
Industrial production surprises on the upside (0.9% vs. 0.3% m/m), while nominal retail sales increase modestly (0.1 actual vs. 0.3% consensus).
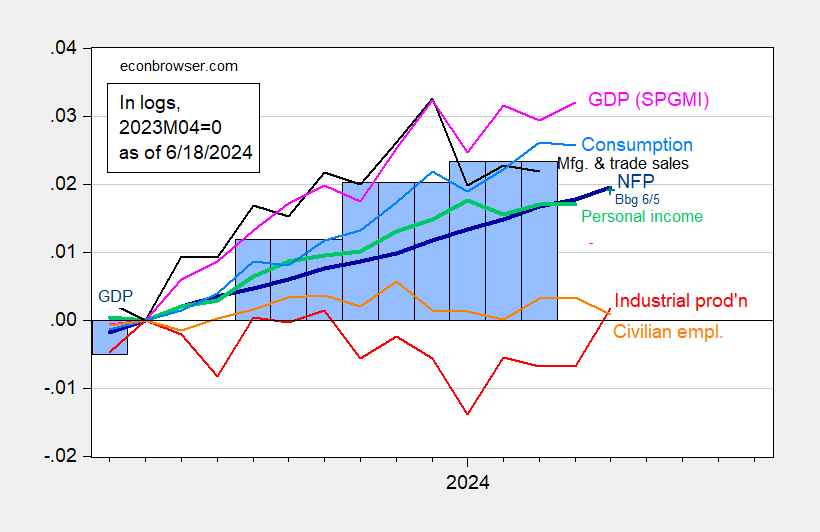
Figure 1: Nonfarm Payroll (NFP) employment from CES (bold blue), civilian employment (orange), industrial production (red), personal income excluding current transfers in Ch.2017$ (bold green), manufacturing and trade sales in Ch.2017$ (black), consumption in Ch.2017$ (light blue), and monthly GDP in Ch.2017$ (pink), GDP (blue bars), all log normalized to 2021M11=0. Source: BLS via FRED, Federal Reserve, BEA 2024Q1 second release, S&P Global Market Insights (nee Macroeconomic Advisers, IHS Markit) (6/1/2024 release), and author’s calculations.
Retail sales:
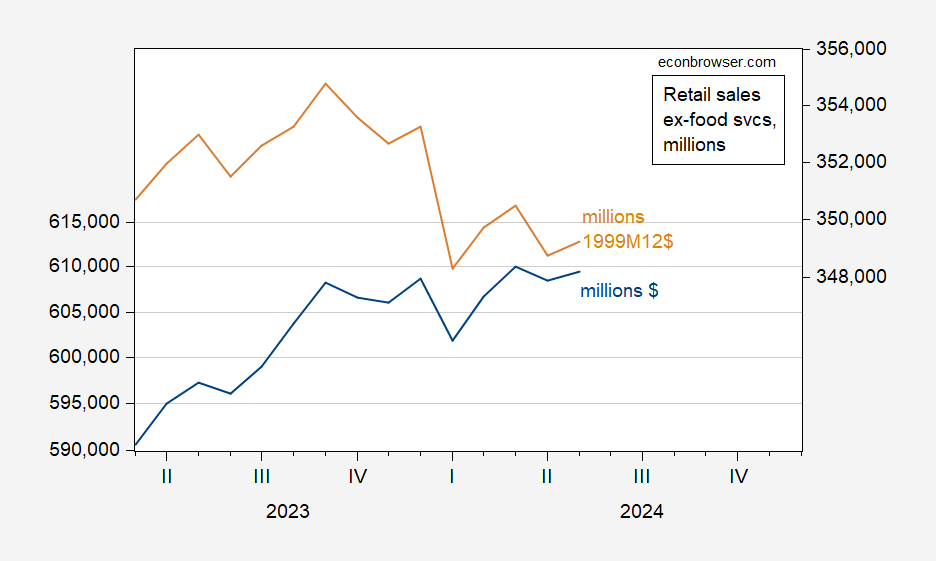
Figure 2: Retail sales, mn $/month (blue, left scale), and in mn 1999M12$/month (tan, right scale). Deflated using chained CPI seasonally adjusted by author using X-13. Source: Census, BLS, author’s calculations.
Core retail sales were down 0.1% vs. consensus +0.2%.
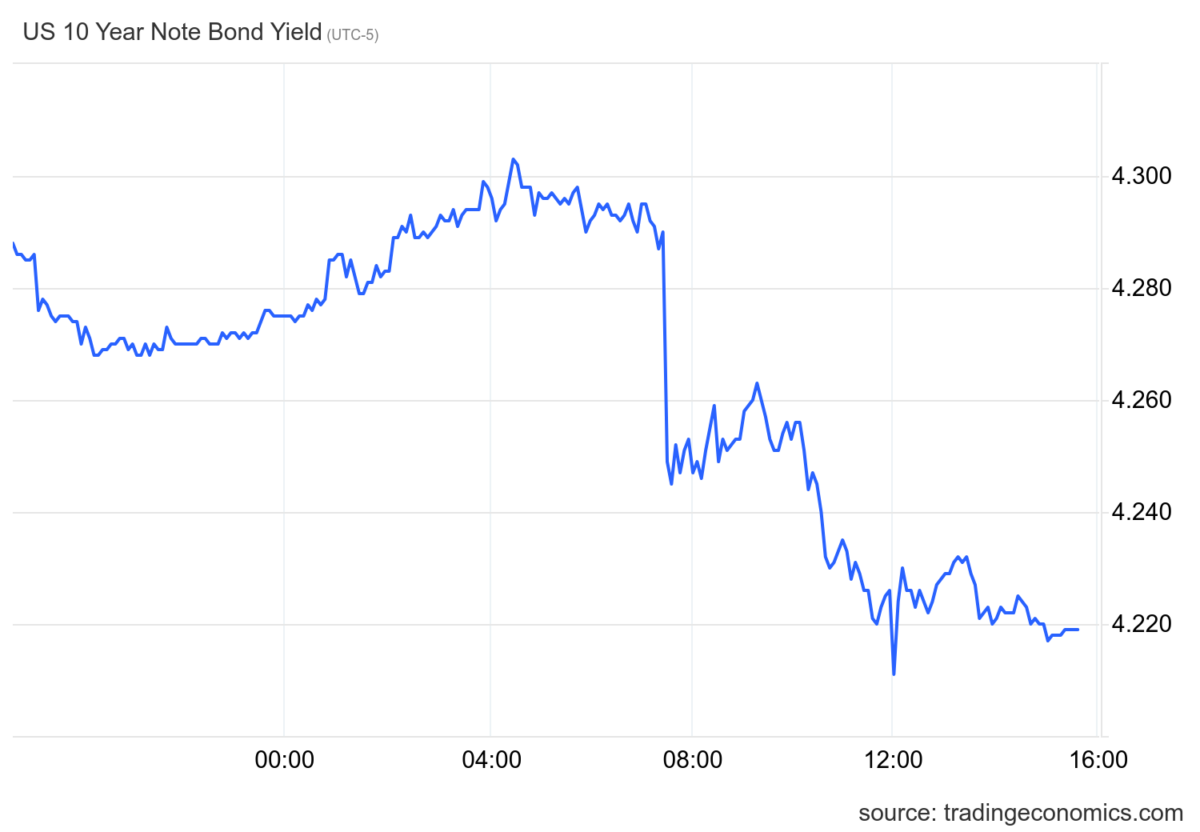
Treasury yields came down noticeably, as a consequence of the cooler-than-expected retail number.
More By This Author:
How Fast Is Nonfarm Payroll Employment Rising?
All Down: Instantaneous Core Inflation Measures For May
Misery And Modified Misery


Comments
Log in or sign up to join the conversation.