
The CBO released an updated Economic Outlook yesterday. Projected PCE inflation is higher, as are budget deficits. First drop in Fed funds rate in 2025Q1. For me, the most interesting are the GDP projections, including with respect to potential GDP.
Here’s the GDP projection as of June, and as of February.
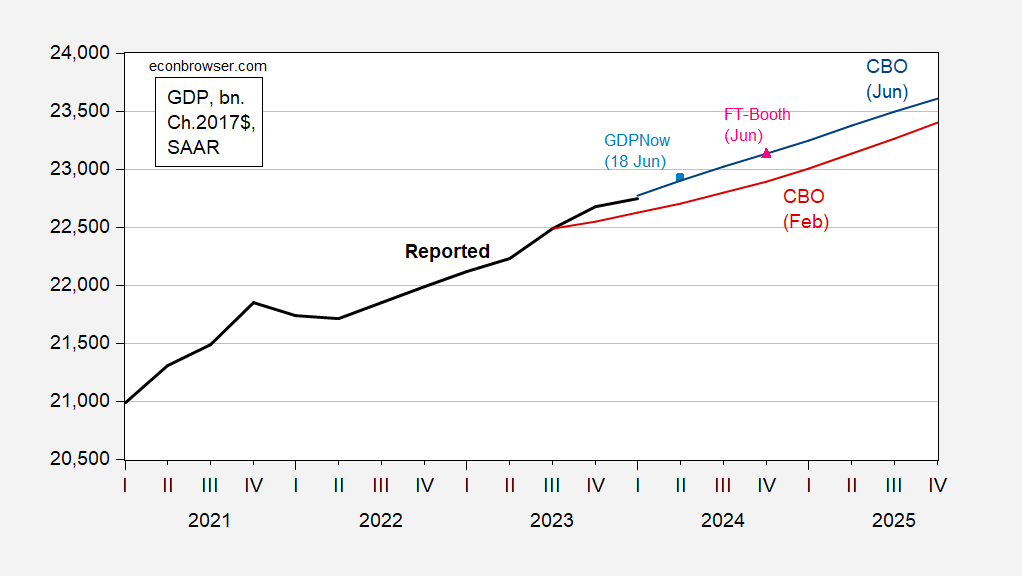
Figure 1: GDP as reported (bold black), February CBO (red), June CBO (blue), FT-Booth median (scarlet triangle), GDPNow as of 18 Jun (light blue square), all in bn.Ch.2017$ SAAR. Source: BEA (2024Q1 2nd release, CBO February Budget and Economic Outlook, CBO June Economic Outlook update, June Booth macroeconomist survey, Atlanta Fed.
The CBO projections are based on data available as of May 2nd. The latest CBO projection is substantially above the February projection (see discussion here), largely due to the intervening upside GDP surprises. It’s currently in line with the FT-Booth June median forecast, and the slightly below (for Q2) the Atlanta Fed nowcast. (It’s slightly above the May median Survey of Professional Forecasters estimate).
While the revised q/q growth rate projections are higher in the short term, relative to February forecast (based on data available as of January 6), then decelerate to slower rates by end 2025, implying reversion to potential. That being said, the current implicit CBO projection of the output gap is dramatically different than reported in the February Economic Outlook. [Update: As suggested by Paweł Skrzypczyński, the implied output gap is even larger using SEP and CBO potential. However, we don’t know what the FOMC’s view on potential GDP is, although the Green Book must have an estimate.]
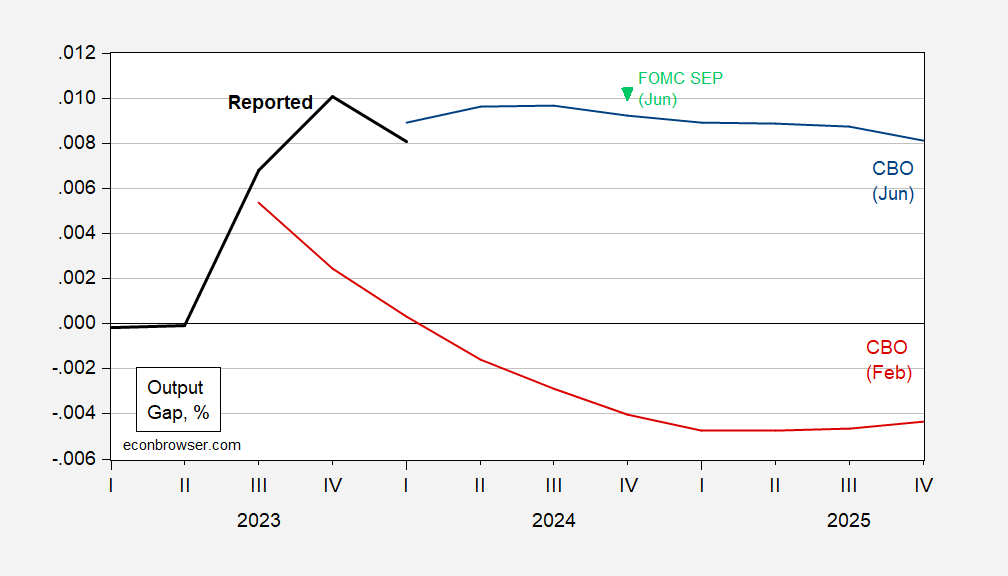
Figure 2 [updated 1pm CT]: Log output gap, in % (bold black), February CBO projection (red), Jun CBO projection (blue), FOMC June Summary of Economic Projections (inverted light green triangle). Reported is based on reported GDP and Jun CBO estimated potential GDP. Source: BEA (2024Q1 2nd release, CBO February Budget and Economic Outlook, CBO June Economic Outlook update, Federal Reserve, and author’s calculations.
This means the CBO is projecting a positive output gap for the next year and half, under current law. For perspective, the pre-pandemic peak output gap was 0.9 ppts, while the highest in recent history is 2.4% in 2000Q2.
It’s interesting to note that the CBO projection is based on an assumption the Fed first starts reducing the Fed Funds rate in 2025Q1; this contrasts with projected rate reduction by about 60 bps (on average) by end of 2024 in the February projection.
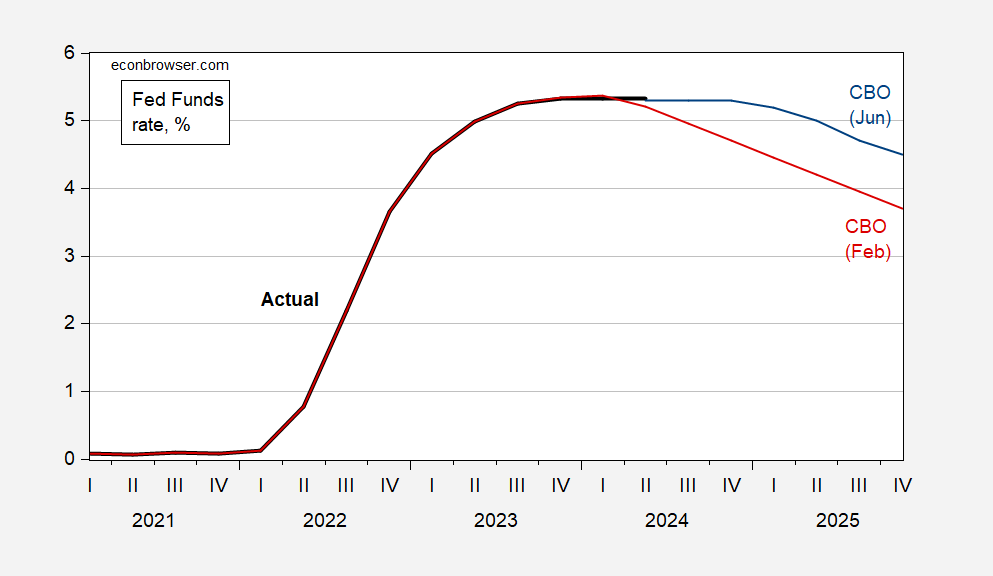
Figure 3: Fed funds rate (bold black), February CBO projection (red), June CBO projection (blue), all in %, period average. Source: Federal Reserve, CBO February Budget and Economic Outlook, CBO June Economic Outlook update.
More By This Author:
Business Cycle Indicators, Mid-JuneHow Fast Is Nonfarm Payroll Employment Rising?
All Down: Instantaneous Core Inflation Measures For May


Comments
Log in or sign up to join the conversation.