
Mahindra & Mahindra - Indian Stocks Elliott Wave Technical Analysis
MAHINDRA & MAHINDRA - Elliott Wave Analysis - Trading Lounge Day Chart
MAHINDRA & MAHINDRA Elliott Wave Technical Analysis
FUNCTION: Bullish Trend
MODE: Impulsive
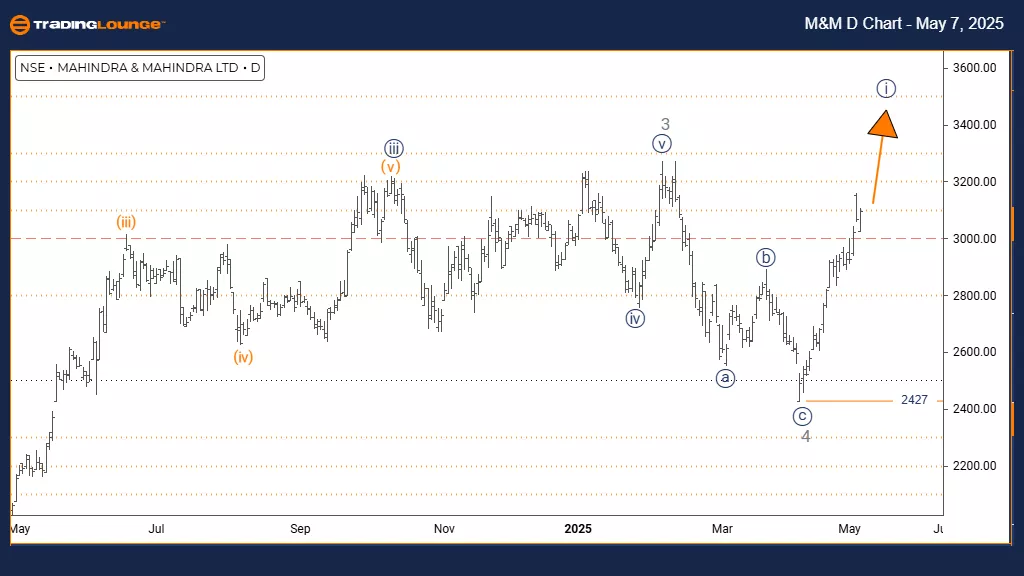
STRUCTURE: Navy Blue Wave 1
POSITION: Gray Wave 5
DIRECTION NEXT LOWER DEGREES: Navy Blue Wave 2
DETAILS: Gray Wave 4 looks completed; Navy Blue Wave 1 of Gray Wave 5 is active.
Wave Cancel/Invalid Level: 2427
The MAHINDRA & MAHINDRA daily chart analysis shows a bullish trend developing through an impulsive Elliott Wave structure. The stock completed Gray Wave 4 correction and has entered Navy Blue Wave 1 inside the broader Gray Wave 5 structure. This setup marks the early stages of what could be the final upward push before a bigger correction happens.
Navy Blue Wave 1 signals the start of the last bullish move, often showing rising momentum as the market builds strength. The completion of Gray Wave 4 set the conditions for this wave, which typically drives prices higher before the trend finishes. The current structure suggests continued strength in the upward move before any correction appears.
The key level to monitor is 2427. A drop below this point would invalidate the current bullish wave count, requiring a reassessment. This level acts as a strong support level that protects the wave 4 low.
The daily timeframe gives a clear view of the new impulse wave starting to build momentum. Traders should watch for traditional wave traits like steadily increasing volume and continuous upward price movement, while remembering this may be the final part of the ongoing bullish cycle.
Technical indicators and price patterns will be essential for confirming the progress of the wave structure. The shift into Gray Wave 5 suggests the possible end of the current bullish phase is near. Traders should look for typical wave completion signs, like divergence on momentum indicators.
The next expected move is Navy Blue Wave 2 after the end of Wave 1. This correction phase should offer a pullback opportunity before the final upward advance in Gray Wave 5 resumes. It represents a strategic chance to participate in the last stage of this bullish trend.
MAHINDRA & MAHINDRA - Elliott Wave Analysis - Trading Lounge Weekly Chart
MAHINDRA & MAHINDRA Elliott Wave Technical Analysis
FUNCTION: Trend
MODE: Impulsive
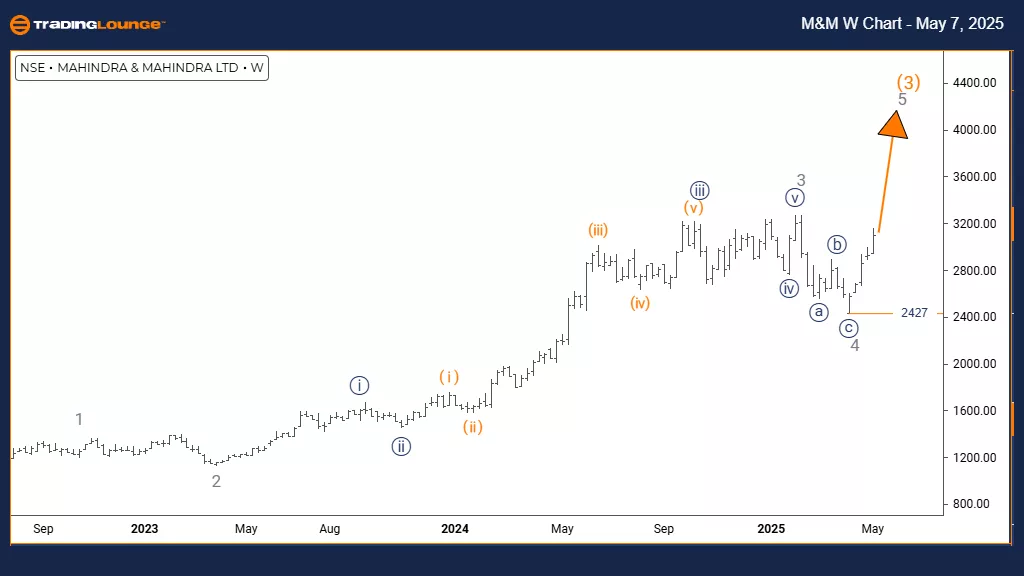
STRUCTURE: Gray Wave 5
POSITION: Orange Wave 3
DIRECTION NEXT HIGHER DEGREES: Gray Wave 5 (started)
DETAILS: Gray Wave 4 appears completed; Gray Wave 5 now active.
Wave Cancel/Invalid Level: 2427
The MAHINDRA & MAHINDRA weekly chart analysis shows a bullish trend nearing its final stages through an impulsive Elliott Wave pattern. The stock has completed the Gray Wave 4 correction and entered Gray Wave 5 within the larger Orange Wave 3 structure. This positioning suggests the last upward move in the current bullish sequence before a possible larger correction.
Gray Wave 5 marks the terminal phase of this upward trend. It can show strong momentum or weakening strength as it nears completion. Completing Wave 4 laid the foundation for this move, often leading to tests or breaks of previous swing highs before exhaustion. The current setup points to the fifth and final wave of the impulsive structure approaching its end.
The weekly timeframe provides important insight into the developing structure, indicating the stock is likely in the late stages of its bullish pattern. Moving into Orange Wave 3 at a higher degree suggests a possibly larger bullish trend is still developing. The critical level to watch is 2427. If prices fall below this level, the current wave count would need to be reassessed.
Traders should observe Wave 5 for common termination signs, such as bearish divergence on momentum indicators or reversal patterns. The analysis advises preparing for a potential trend change as the fifth wave ends, although wave extensions can sometimes extend the bullish move further than expected.
Technical indicators and price patterns are key to confirming when the upward momentum slows and the corrective phase begins. Finishing Gray Wave 5 would signal a potential larger correction. Careful observation of price action will be crucial for identifying the best exit points as the structure completes.
Technical Analyst: Malik Awais
More By This Author:
Elliott Wave Technical Analysis: Cardano Crypto Price News For Wednesday, May 7
Unlocking ASX Trading Success: Car Group Limited - Tuesday, May 6
Elliott Wave Technical Analysis: Cocoa Commodity - Tuesday, May 6
At TradingLounge™, we provide actionable Elliott Wave analysis across over 200 markets. Access live chat rooms, advanced AI & algorithmic charting tools, and curated trade ...
more

