
Cocoa Elliott Wave Analysis
Cocoa continues its correction of the overall bullish trend, specifically, the bullish cycle from September 2022. Although the long-term bullish trend is anticipated to resume, the corrective pullback beginning in December 2024 seems not yet complete.
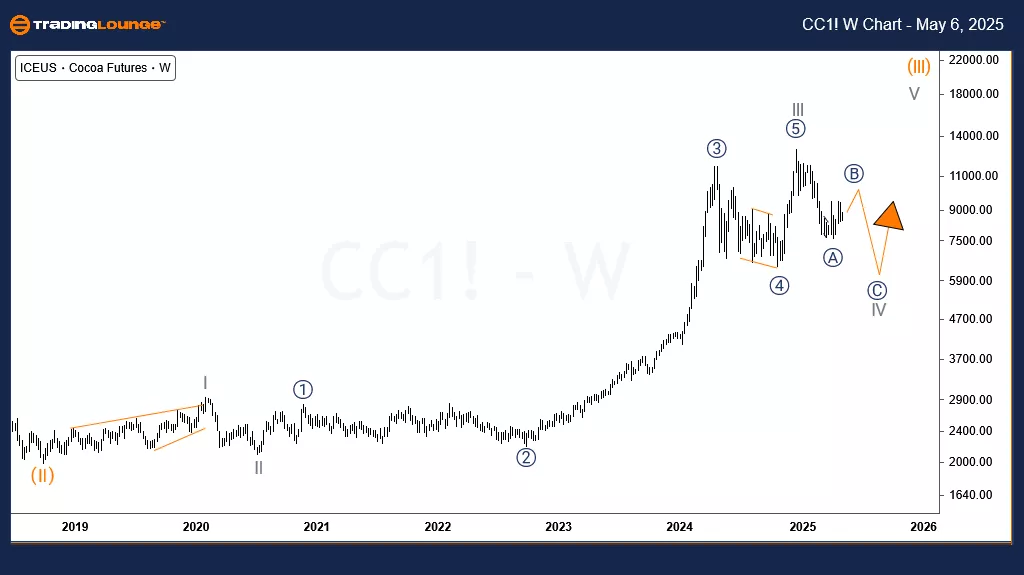
Cocoa Long-Term View (Weekly Chart)
The supercycle degree bullish move started in April 2017, visible on the weekly chart. Waves (I) and (II) were completed by April 2018 and October 2018, respectively, followed by some choppy movements for waves I and II of (III) and then ((1)) and ((2)) of III between October 2018 and September 2022. A significant breakout occurred late in 2022, pushing prices beyond 11,000 to complete wave ((3)) of III. Wave III peaked in December 2024, initiating the current pullback for wave IV. Based on the H4 chart, wave IV appears unfinished.
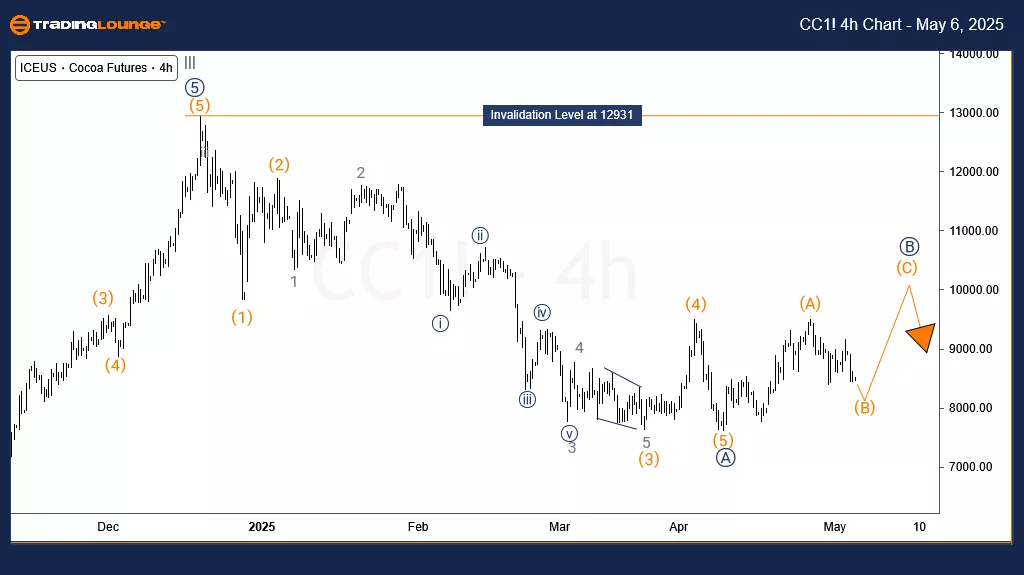
Cocoa H4 Chart Analysis
In the H4 timeframe, Cocoa prices completed wave ((A)) of IV with an impulsive structure, followed by a developing bounce for ((B)). It seems wave ((B)) might have one more upward leg to complete wave (C) of ((B)) before turning downward, provided the 12931 record high remains intact. Consequently, in the short term, a downside move is preferred. However, the long-term outlook remains bullish for wave V of (III).
Technical Analyst : Sanmi Adeagbo
More By This Author:
Unlocking ASX Trading Success: Car Group Limited - Tuesday, May 6
Elliott Wave Technical Analysis: U.S. Dollar/Swiss Franc - Tuesday, May 6
Elliott Wave Technical Analysis: NEO Crypto Price News For Tuesday, May 6


Comments
Log in or sign up to join the conversation.