

Image Source: Upsplash
Elliott Wave Analysis | TradingLounge Daily Chart
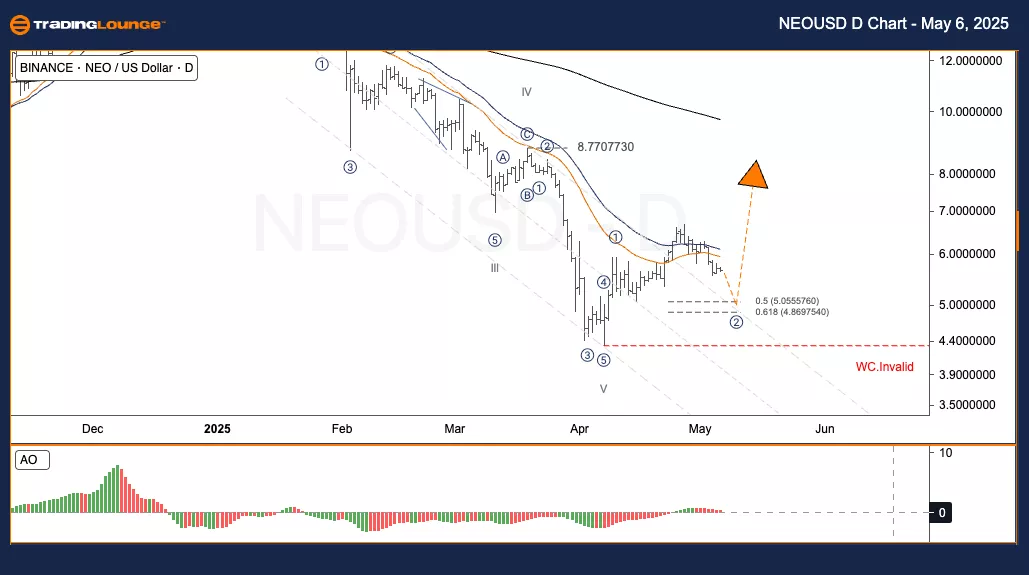
NEO/ U.S. Dollar (NEOUSD)
NEOUSD Elliott Wave Technical Analysis
Function: Follow Trend
Mode: Motive
Structure: Impulse
Position: Wave ((2))
Next Higher Degree Direction:
Wave Cancel Invalid Level:
NEO/ U.S. Dollar (NEOUSD) Trading Strategy
NEO has completed wave (1) and is now consolidating within a Flat A-B-C correction for wave (2).
Key support lies at the Fibonacci 50%–61.8% retracement zone, between $5.05 – $4.87.
This area is a high-probability reversal zone, provided price action does not drop below the W.C. Invalid level at $4.00.
Trading Strategies
Strategy
Short-Term Traders (Swing Trade)
✅ Wait for the price to retrace toward the $5.05 – $4.87 zone.
✅ Look for reversal signs (Bullish Candlestick / RSI Divergence / Volume Spike).
Risk Management
🟥 Wave Cancel Invalid: $4.00 (If price falls below = Wave Count invalidation)
Elliott Wave Analysis | TradingLounge H4 Chart
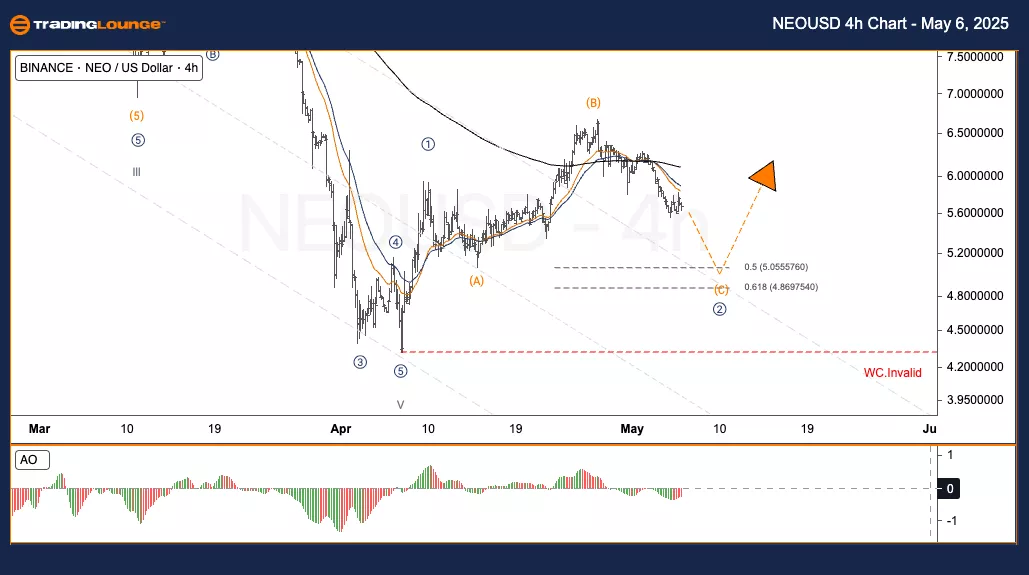
NEO/ U.S. Dollar (NEOUSD)
NEOUSD Elliott Wave Technical Analysis
Function: Follow Trend
Mode: Motive
Structure: Impulse
Position: Wave ((2))
Next Higher Degree Direction:
Wave Cancel Invalid Level:
NEO/ U.S. Dollar (NEOUSD) Trading Strategy
Following the completion of wave (1), NEO is forming a Flat A-B-C pattern inside wave (2).
Important support is observed around the Fibonacci 50%–61.8% range, $5.05 – $4.87.
This level offers a strong reversal opportunity, provided it holds above the W.C. Invalid level at $4.00.
Trading Strategies
Strategy
Short-Term Traders (Swing Trade)
✅ Monitor for a retracement toward $5.05 – $4.87.
✅ Watch for bullish reversal signals (Candle Pattern / RSI Divergence / Volume Increase).
Risk Management
🟥 Wave Cancel Invalid: $4.00 (Break below confirms incorrect wave count)
TradingLounge Analyst: Kittiampon Somboonsod, CEWA
More By This Author:
Unlocking ASX Trading Success: Insurance Australia Group Limited - Monday, May 5
Natural Gas - Elliott Wave Technical Analysis
Elliott Wave Technical Analysis: U.S. Dollar/Japanese Yen - Monday, May 5


Comments
Log in or sign up to join the conversation.