
USDJPY Elliott Wave Analysis - Trading Lounge
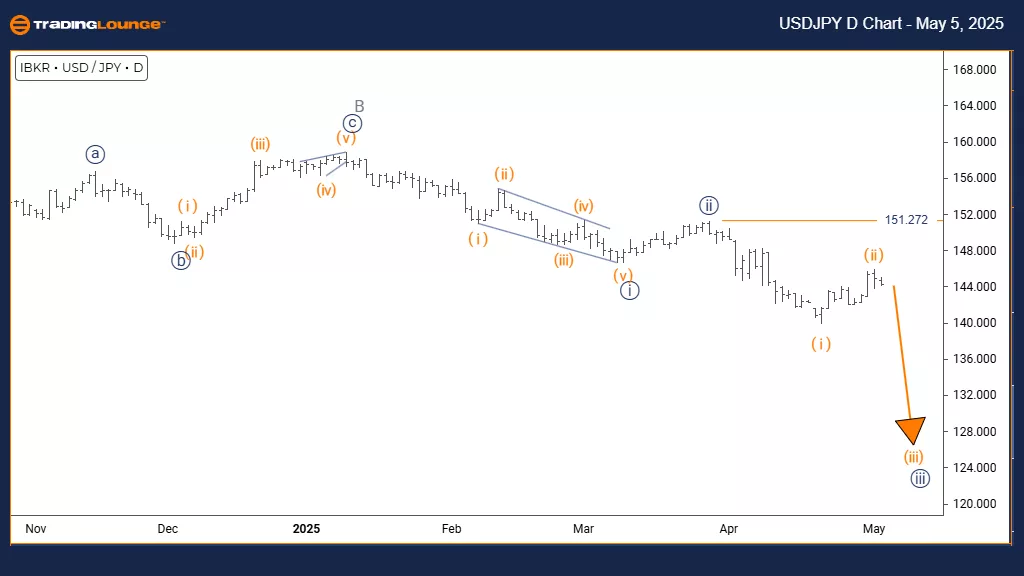
U.S. Dollar / Japanese Yen (USDJPY) Day Chart
USDJPY Elliott Wave Technical Analysis
FUNCTION: Bearish Trend
MODE: Impulsive
STRUCTURE: Orange Wave 3
POSITION: Navy Blue Wave 3
DIRECTION NEXT LOWER DEGREES: Orange Wave 3 (in progress)
DETAILS: Orange Wave 2 appears completed, now Orange Wave 3 is active.
Wave Cancel Invalid Level: 151.272
Daily Chart Analysis Overview
The USDJPY daily chart highlights a clear bearish trend developing through an impulsive Elliott Wave structure. The currency pair has finished the Orange Wave 2 correction and now entered Orange Wave 3, positioned within the broader Navy Blue Wave 3. This suggests the market has entered its strongest downward phase, typically marked by sharp price declines and strong momentum.
Orange Wave 3 is the main trending segment within the Elliott Wave model, often driving the most substantial price moves. With Wave 2’s correction concluded, Wave 3’s decline is likely to surpass Wave 1's magnitude. The current formation implies that the downtrend should continue strongly before any significant corrections occur.
Market Structure and Strategy Insights
The daily timeframe gives essential insight into this structure, indicating a critical phase within the broader bearish sequence. Entering Navy Blue Wave 3 at a higher degree suggests an even larger downward trend unfolding across longer periods. Key to this structure is the invalidation point at 151.272—a daily close above this level would necessitate reevaluating the bearish outlook.
Traders should watch Orange Wave 3 for typical signs: strong momentum, higher volume during declines, and steady downward progress. The recommendation remains to maintain bearish positions through this impulsive phase while closely monitoring for any signs of Wave 3 completion. Technical indicators and price action will offer essential confirmation.
Next Phase and Trading Opportunities
The next key development is the formation of Orange Wave 4 after Orange Wave 3 finishes. This corrective wave should offer a brief pullback opportunity before the bearish trend possibly resumes. Current conditions favor trend-following strategies, as Wave 3 often provides the most advantageous setups within Elliott Wave patterns.
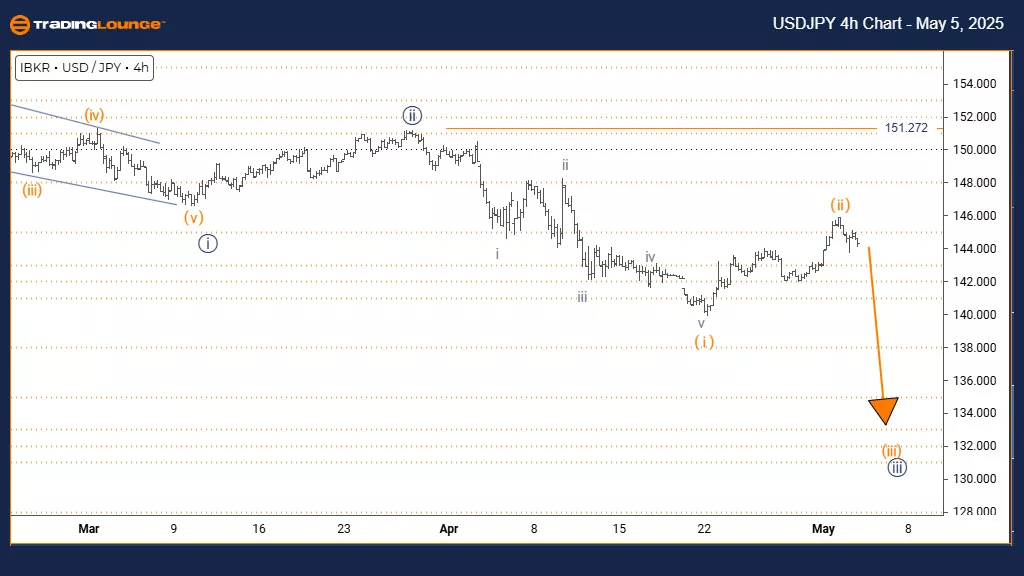
U.S. Dollar / Japanese Yen (USDJPY) 4-Hour Chart
USDJPY Elliott Wave Technical Analysis
FUNCTION: Bearish Trend
MODE: Impulsive
STRUCTURE: Orange Wave 3
POSITION: Navy Blue Wave 3
DIRECTION NEXT LOWER DEGREES: Orange Wave 3 (started)
DETAILS: Orange Wave 2 appears completed, Orange Wave 3 is now active.
Wave Cancel Invalid Level: 151.272
4-Hour Chart Analysis Overview
The USDJPY 4-hour chart highlights a strong bearish trend forming within an impulsive Elliott Wave structure. The pair has completed the Orange Wave 2 correction and has now started Orange Wave 3, positioned inside the broader Navy Blue Wave 3 structure. This setup points to the most powerful stage of the downward trend, often marked by sharp price declines and strong momentum.
Orange Wave 3 acts as the main trending part of Elliott Wave patterns, usually delivering the most forceful moves. With the correction of Wave 2 completed, the downward move in Wave 3 typically exceeds the size of Wave 1. Current analysis suggests the bearish momentum will likely continue firmly before any notable corrections appear.
Market Structure and Trading Strategy
The 4-hour timeframe offers critical insights into the ongoing market structure, indicating a vital stage in the broader bearish sequence. The transition into Navy Blue Wave 3 signals the potential start of a larger downward move across various timeframes. A key level to monitor is 151.272—any price action breaking above this level would necessitate a reassessment of the bearish wave structure.
Traders should observe Orange Wave 3’s progression, looking for classic traits like strong momentum and steady downward development. The advice remains to maintain bearish strategies during this impulsive phase, carefully watching for any early signs of Wave 3 completion. Technical indicators and price patterns will provide essential confirmation signals as the trend unfolds.
Next Steps and Market Expectations
The next major movement expected is the formation of Orange Wave 4 after the end of Wave 3. This corrective phase should offer a brief pullback opportunity before the bearish trend potentially resumes. The current stage provides an ideal environment for trend-following tactics, as Wave 3 typically generates the most favorable trading conditions in Elliott Wave patterns.
Technical Analyst: Malik Awais
More By This Author:
Ripple (XRPUSD) Crypto Price News And Analysis
VanEck Gold Miners ETF GDX - Elliott Wave Technical Analysis
Silver XAGUSD Commodity - Elliott Wave Analysis


Comments
Log in or sign up to join the conversation.