
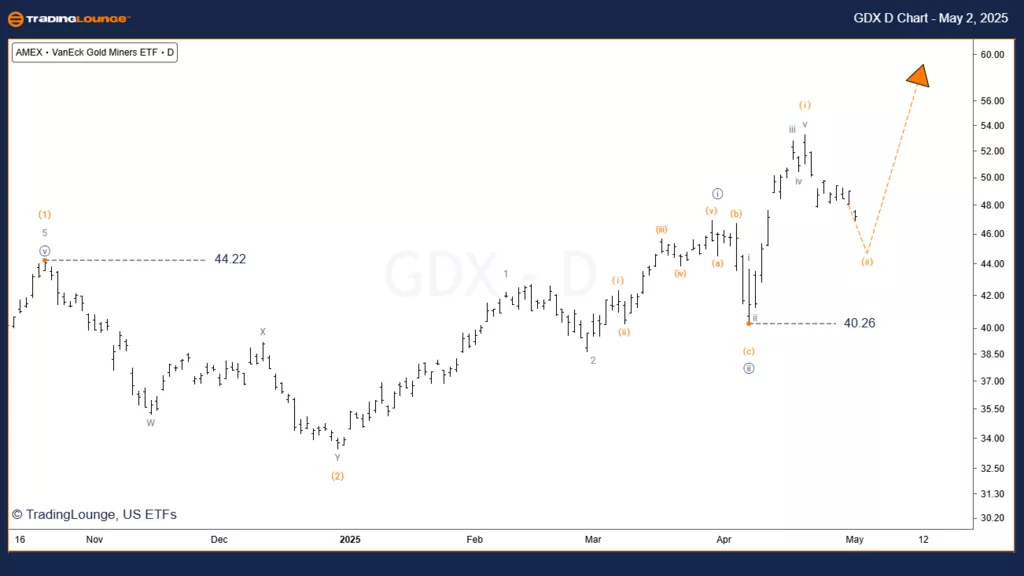
GDX Daily Chart Analysis (1D)
Function: Major Trend
Mode: Motive
Structure: Impulse
Position: Wave [iii] navy
Direction: Rally
Details:
Wave 3 has entered its strongest phase — the third of a third of a third.
The next rally is expected to reach around $55.24 for wave [iii], with the potential to extend even higher.
A possible wave extension suggests a long-term bullish move is unfolding.
Key Support Level: $42.00
Invalidation Level: $40.26
(Click on image to enlarge)
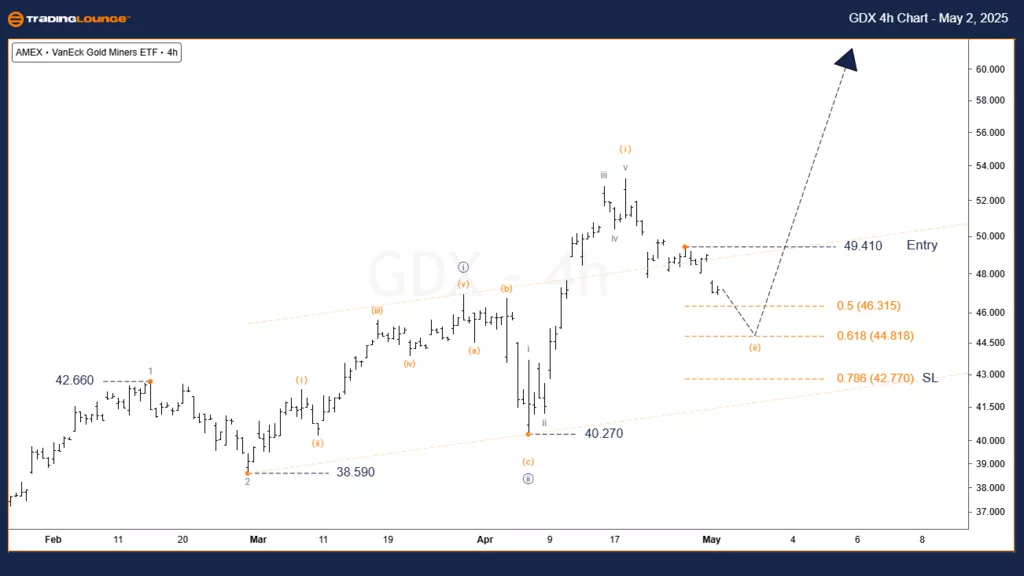
GDX 4-Hour Chart Analysis (4H)
Function: Major Trend (Minor Degree, Grey)
Mode: Motive
Structure: Impulse
Position: Wave (ii) of [iii]
Direction: Mini decline
Details:
Wave (i) of [iii] has completed, and wave (ii) is now forming.
The ongoing decline should find support around the $46.00 level, close to the centerline of the Kennedy Base Channel of wave [i].
A minor final push downward is expected before a strong rally in wave (iii) resumes.
Suggested Entry: $49.410
Stop Loss: Just below $42.770
Invalidation Level: $40.27
(Click on image to enlarge)
Conclusion:
GDX remains in a young and developing uptrend.
The current phase demands patience, as traders wait for a clearer setup to rejoin the rally.
$40.27 serves as the critical invalidation level for the bullish count.
Strict adherence to Elliott Wave rules and attention to invalidation points is essential to minimize trading risks.
Technical Analyst: Simon Brooks
Source: Visit TradingLounge.com and learn from the experts!
Join TradingLounge Today!
More By This Author:
SEI Crypto Price News - Elliott Wave Technical Analysis
Energy Select Sector ETF XLE - Elliott Wave Technical Analysis
Trading Strategies For S&P 500, Nasdaq 100, DAX 40, FTSE 100 & ASX 200


Comments
Log in or sign up to join the conversation.