
Elliott Wave Analysis TradingLounge Daily Chart,
SEI/ U.S. dollar (SEIUSD)
SEIUSD Elliott Wave Technical Analysis
Function: Follow Trend
Mode: Motive
Structure: Impulse
Position: Wave 2
Direction Next Higher Degrees:
Wave Cancel Invalid Level:
SEI/ U.S. dollar (SEIUSD) Trading Strategy:
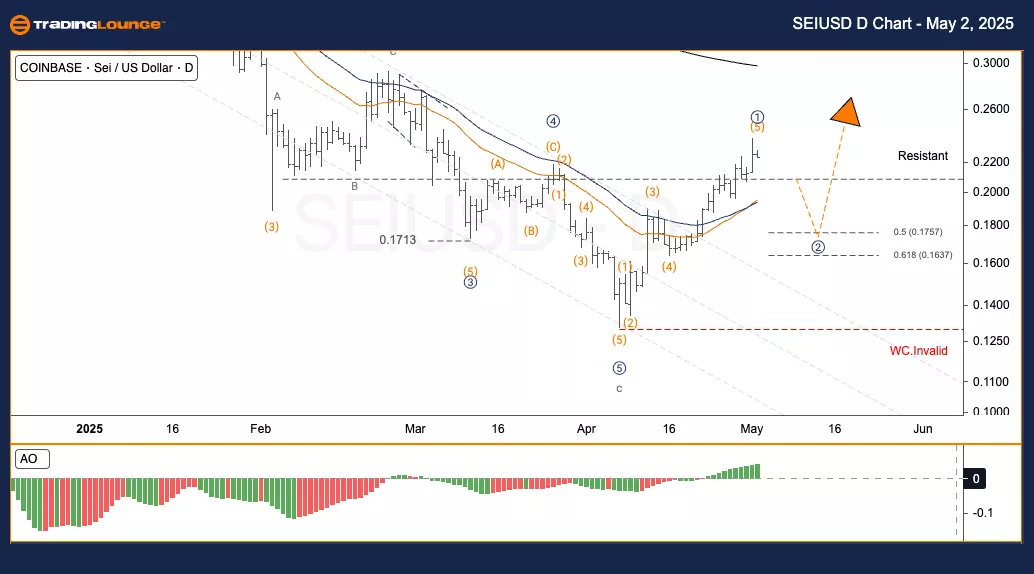
After a long correction period in early 2025, SEIUSD appears to have completed its last downward movement around the $0.13–0.14 range. The price has started a strong upward move, initiating a new wave ①. Currently, SEIUSD is beginning wave ②, likely forming an (A)-(B)-(C) corrective structure.
Wave ② Support Targets:
50% Retracement: $0.1757
61.8% Retracement: $0.1637
Wave Cancel Invalid Level: If SEIUSD falls below $0.13, the current structure would be invalid and needs reassessment.
Trading Strategies
Strategy:
For Short-Term Traders (Swing Trading):
Wait for a retracement into the Fibonacci upper zone and look for a reversal signal before entering trades.
Risk Management:
Place stop-loss orders carefully below the $0.16 support area or use $0.13 as an invalidation point.
(Click on image to enlarge)
Elliott Wave Analysis TradingLounge H4 Chart,
SEI/ U.S. dollar (SEIUSD)
SEIUSD Elliott Wave Technical Analysis
Function: Follow Trend
Mode: Motive
Structure: Impulse
Position: Wave 2
Direction Next Higher Degrees:
Wave Cancel Invalid Level:
SEI/ U.S. dollar (SEIUSD) Trading Strategy:
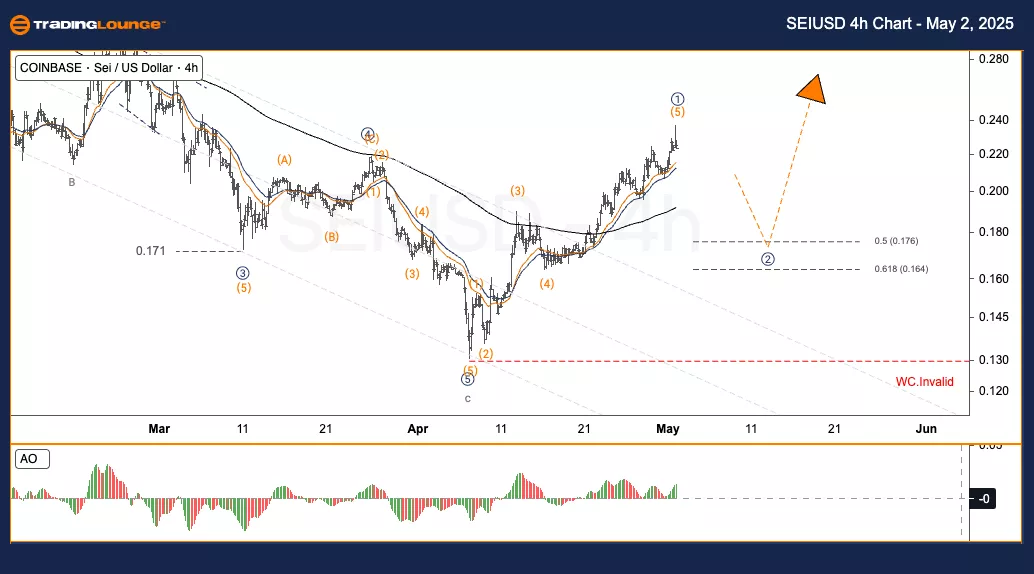
After an extended corrective move in early 2025, SEIUSD appears to have finalized its downward structure around $0.13–0.14 and is now experiencing a sharp recovery forming wave ①. It has now entered wave ②, which is anticipated to unfold in an (A)-(B)-(C) pattern.
Wave ② Support Targets:
50% Retracement: $0.1757
61.8% Retracement: $0.1637
Wave Cancel Invalid Level: If SEIUSD drops below $0.13, the wave count would be invalidated and a new analysis would be required.
Trading Strategies
Strategy:
For Short-Term Traders (Swing Trading):
Wait for a retracement towards the upper Fibonacci retracement zone, then look for a reversal signal to initiate positions.
Risk Management:
Apply stop-loss orders just under the $0.16 level or alternatively at the $0.13 invalidation mark.
(Click on image to enlarge)
More By This Author:
Trading Strategies For S&P 500, Nasdaq 100, DAX 40, FTSE 100 & ASX 200
Qualcomm Inc. - Elliott Wave Technical Analysis
Bharat Electronics - Elliott Wave Technical Analysis


Comments
Log in or sign up to join the conversation.