
Silver Outlook
Silver may correct deeper from the recovery that started at the low of April 2025 before resuming its long-term bullish trend. A major corrective cycle ended above $28 on April 6, 2025. The commodity is now poised to attract buyers from dips, potentially pushing prices above the 2024 highs.
Silver Daily Chart Analysis
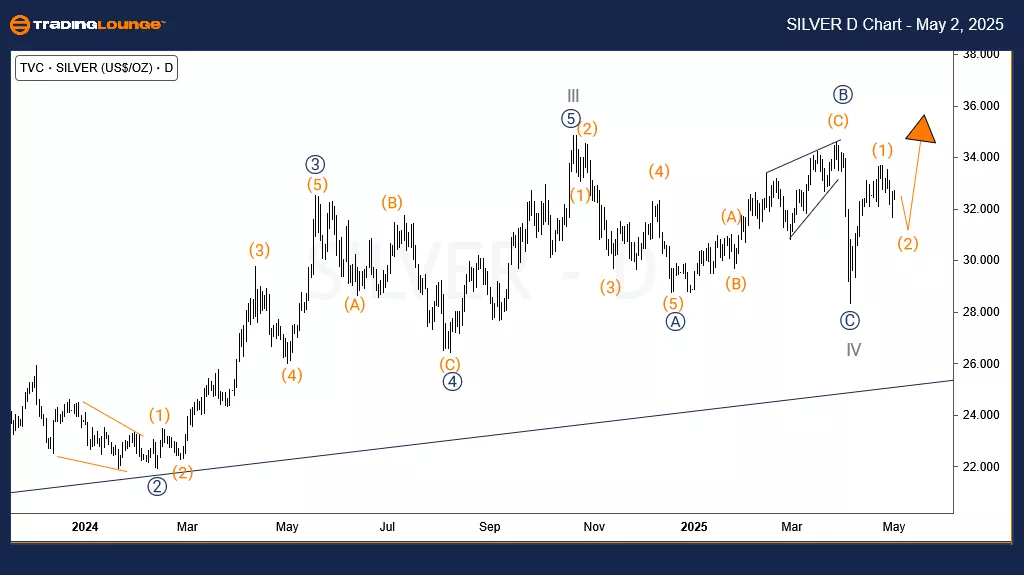
On the daily chart, Silver completed the cycle degree wave III in October 2024. After reaching the 2024 high, the price entered a corrective move — cycle degree wave IV — to retrace the wave III advance that began in October 2023. Wave IV unfolded as a zigzag pattern and concluded above $28 in April 2025.
From this April low, Silver surged impulsively, forming wave (1) of V and completing it by late April 2025. The ongoing pullback represents wave (2), which is expected to end above $28.2. Following the completion of wave (2), a strong rally in wave (3) is anticipated, targeting prices above the highs of 2024.
(Click on image to enlarge)
Silver H4 Chart Analysis
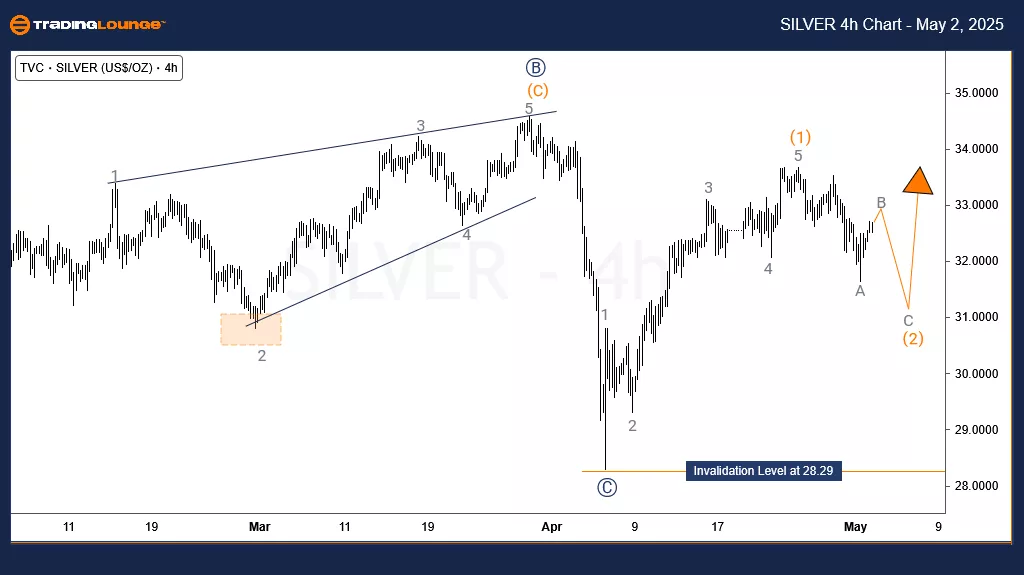
The H4 chart zooms in on the sub-waves of wave (2). It remains uncertain whether wave (2) has already completed at the low on May 1, 2025, or whether it will develop into a deeper double correction. Given that Gold has not yet finished a similar corrective move, Silver could also extend lower.
Regardless, the expectation is for a break above the wave (1) high to confirm that wave (3) is underway. Across multiple timeframes — from H1 up to the weekly — Silver continues to attract buying interest, with traders seeking to buy from dips or position themselves on breakouts.
(Click on image to enlarge)
More By This Author:
Energy Select Sector ETF XLE - Elliott Wave Technical Analysis
Trading Strategies For S&P 500, Nasdaq 100, DAX 40, FTSE 100 & ASX 200
Qualcomm Inc. - Elliott Wave Technical Analysis


Comments
Log in or sign up to join the conversation.