
Natural Gas Overview
Natural Gas has been recovering since April 24th, following the pullback that started in March. If the commodity stays above the April 24th low, it could push toward $6 in the coming weeks.
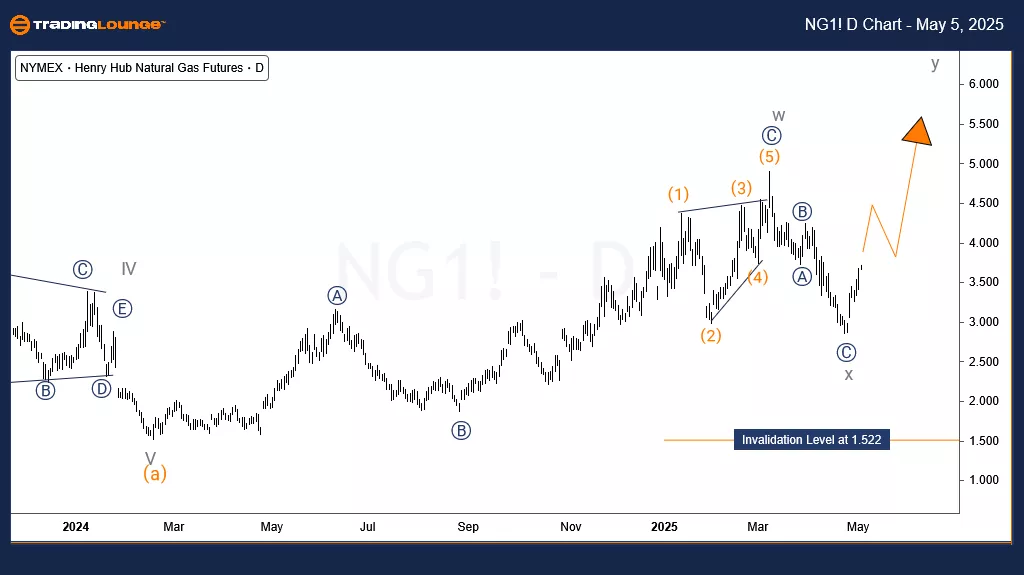
Natural Gas Daily Chart Analysis
Since August 2022, Natural Gas declined from around $10 and completed a bearish impulse structure by February 2024 near $1.5. According to Elliott Wave Theory, a completed 5-wave cycle should be followed by a 3-wave correction. After hitting the February low, Natural Gas started correcting the preceding impulse decline.
The daily chart shows that the bounce from February 2024 has been evolving into a double zigzag structure.
Wave w of the cycle degree completed with a zigzag structure by March 2025.
A pullback followed, ending the corresponding cycle degree wave x in April 2025.
The current rally forms part of Wave y of (b), with a projected target around $6.25 if the bullish momentum continues.
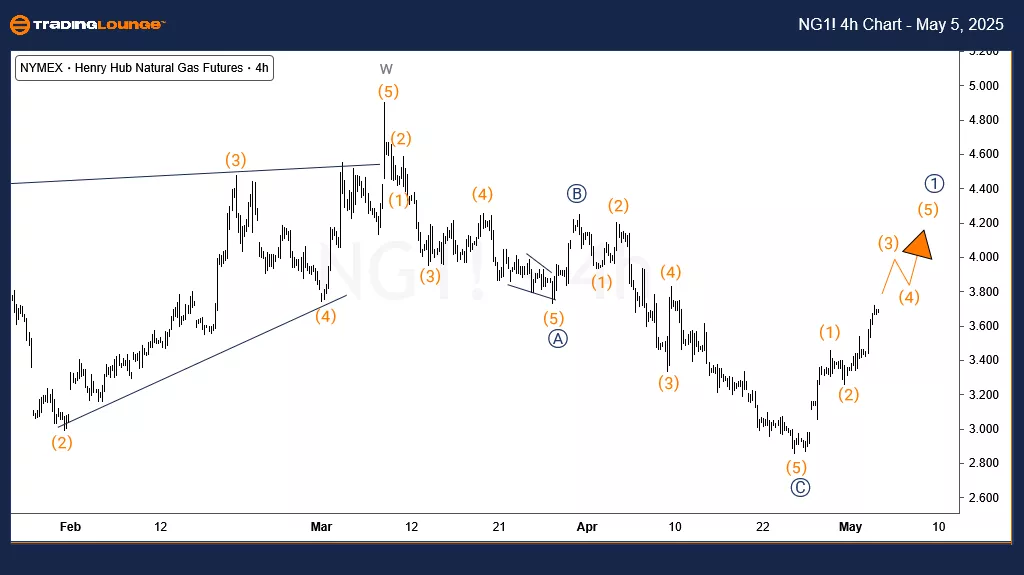
Natural Gas 4-Hour Chart Analysis
The H4 chart reveals that the rally from the April low could develop in two possible ways:
Either as a 5-wave impulse,
Or as a 3-wave correction, aiming toward 4.23 and above, or at least 3.86-4.00 range.
Thus, as long as Natural Gas trades above the $2.86 April 2025 low, further upside is favored. Dips are expected to offer buying opportunities in line with the bullish structure.
Technical Analyst : Sanmi Adeagbo
More By This Author:
Unlocking ASX Trading Success: Insurance Australia Group Limited - Monday, May 5
Elliott Wave Technical Analysis: U.S. Dollar/Japanese Yen - Monday, May 5
Elliott Wave Technical Analysis: Russell 2000 Index - Monday, May 5


Comments
Log in or sign up to join the conversation.