
U.S. Dollar / Swiss Franc (USDCHF) Day Chart
USDCHF Elliott Wave Technical Analysis
FUNCTION: Trend
MODE: Impulsive
STRUCTURE: Orange wave 5
POSITION: Navy blue wave 1
DIRECTION NEXT HIGHER DEGREES: Navy blue wave 2
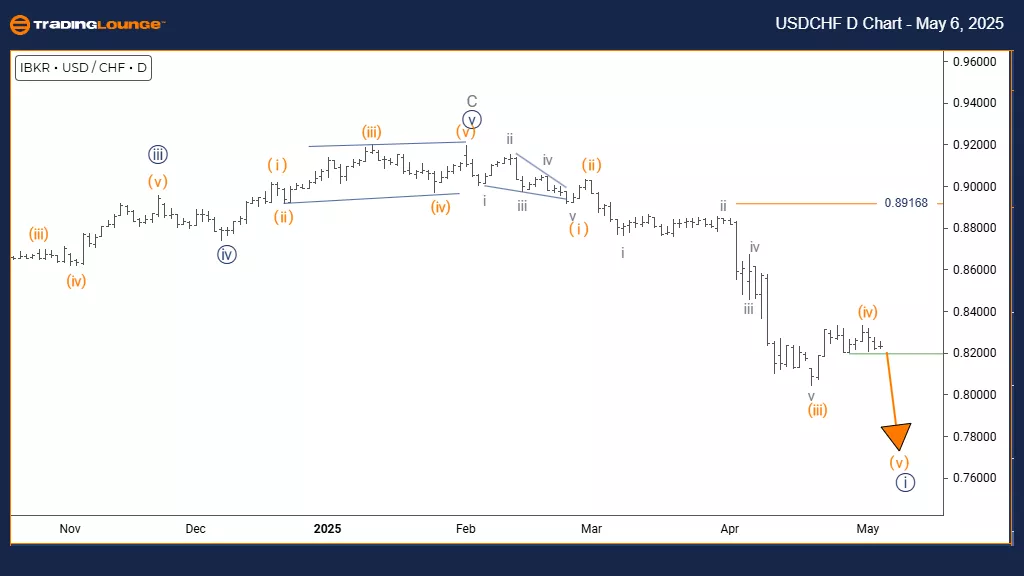
DETAILS: Orange wave 4 appears completed, and orange wave 5 is currently underway.
Wave Cancel Invalidation Level: 0.89168
The USDCHF daily chart highlights a strong trending move unfolding through an impulsive Elliott Wave structure. The pair has completed its orange wave 4 correction and entered orange wave 5, within the larger navy blue wave 1 formation. This setup indicates the final upward movement in the current bullish cycle before a possible larger correction.
Orange wave 5 marks the terminal phase of this upward move, often displaying either strong momentum or weakening strength as the pattern concludes. With wave 4 correction finished, the market is now positioned for the final push, typically testing or surpassing previous swing highs before trend exhaustion. The current structure suggests the upward move is nearing completion, forming the fifth and final wave of the impulsive sequence.
The daily timeframe offers important insight into this ongoing formation, indicating the pair is in the later stages of its bullish run. The movement into navy blue wave 1 at a higher degree implies that a more substantial upward structure may still be unfolding. Traders should closely monitor wave 5 for typical end-wave features such as divergence in momentum indicators or reversal signals.
An important invalidation level to observe is 0.89168. A break below this level would invalidate the current bullish interpretation and require a reevaluation of the pattern. This price level acts as key support, safeguarding the low of wave 4.
Following the completion of orange wave 5, the next expected move is navy blue wave 2, a corrective phase likely offering a pullback opportunity before any further continuation of the bullish trend. This current phase is crucial for traders to watch for signs of trend exhaustion and potential reversal signals.
Technical indicators and clear price behavior will be essential for confirming when the bullish momentum fades and the corrective phase begins. Careful monitoring of price action will help confirm the transition from the current wave to the next stage. The daily view emphasizes the importance of this structure for medium-term trading strategies.
U.S. Dollar / Swiss Franc (USDCHF) 4 Hour Chart
USDCHF Elliott Wave Technical Analysis
FUNCTION: Trend
MODE: Impulsive
STRUCTURE: Orange wave 5
POSITION: Navy blue wave 1
DIRECTION NEXT LOWER DEGREES: Orange wave 5 (started)
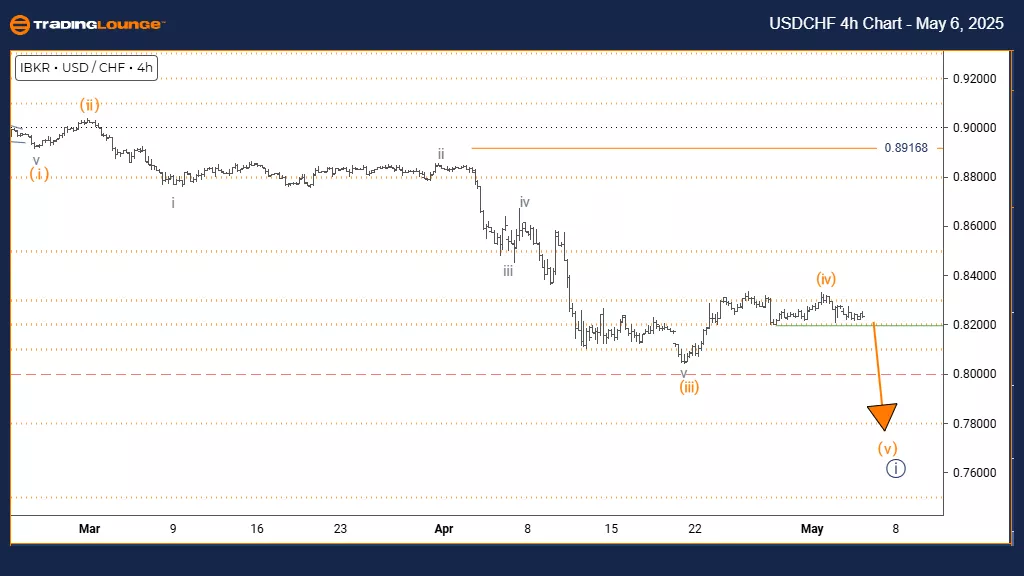
DETAILS: Orange wave 4 appears completed, and orange wave 5 is now in progress.
Wave Cancel Invalidation Level: 0.89168
The USDCHF 4-hour chart shows a developing strong trend through an impulsive Elliott Wave structure. The pair has completed its orange wave 4 correction and entered orange wave 5, within the larger navy blue wave 1 formation. This position indicates the final upward movement in the current bullish sequence before a larger corrective phase.
Orange wave 5 marks the final phase of this upward move, typically displaying either strong or fading momentum as the pattern completes. With the correction of wave 4 finished, the market now sets the stage for the last wave, often testing or slightly exceeding previous highs before weakening. The current structure hints that the upward trend may soon reach its conclusion, forming the fifth and final wave of the impulse sequence.
The next expected move will be navy blue wave 2, following the completion of orange wave 5. Navy blue wave 2 is anticipated to be a corrective phase, offering a potential pullback after the present rally ends. An important invalidation level to monitor is 0.89168. A move below this level would invalidate the current Elliott Wave count and require a reassessment of the market structure.
Market participants should stay alert for typical wave 5 termination signals, including possible bearish divergences on momentum indicators or reversal patterns. The 4-hour timeframe provides important context, suggesting that the pair may be close to completing its immediate upward trend. Traders should prepare for signs of trend exhaustion while recognizing that wave 5 can sometimes extend beyond normal expectations.
Technical indicators and clear price action will be critical for confirming when the bullish momentum starts to weaken and corrective wave 2 begins. Monitoring for signs of trend completion and respecting the invalidation level are key steps for traders. A transition into wave 2 will likely signal a temporary pause in the uptrend before any continuation.
Technical Analyst: Malik Awais
More By This Author:
Unlocking ASX Trading Success: Insurance Australia Group Limited - Monday, May 5
Natural Gas - Elliott Wave Technical Analysis
Elliott Wave Technical Analysis: U.S. Dollar/Japanese Yen - Monday, May 5


Comments
Log in or sign up to join the conversation.