
Indian Stocks Bajaj Auto
BAJAJ AUTO Elliott Wave Analysis – Trading Lounge Day Chart
BAJAJ AUTO Elliott Wave Technical Overview
FUNCTION: Bullish Trend
MODE: Impulsive
STRUCTURE: Orange Wave 3
POSITION: Navy Blue Wave 1
DIRECTION OF HIGHER DEGREES: Orange Wave 3 (Initiated)
DETAILS: The corrective phase of Orange Wave 2 appears complete, with Orange Wave 3 now unfolding.
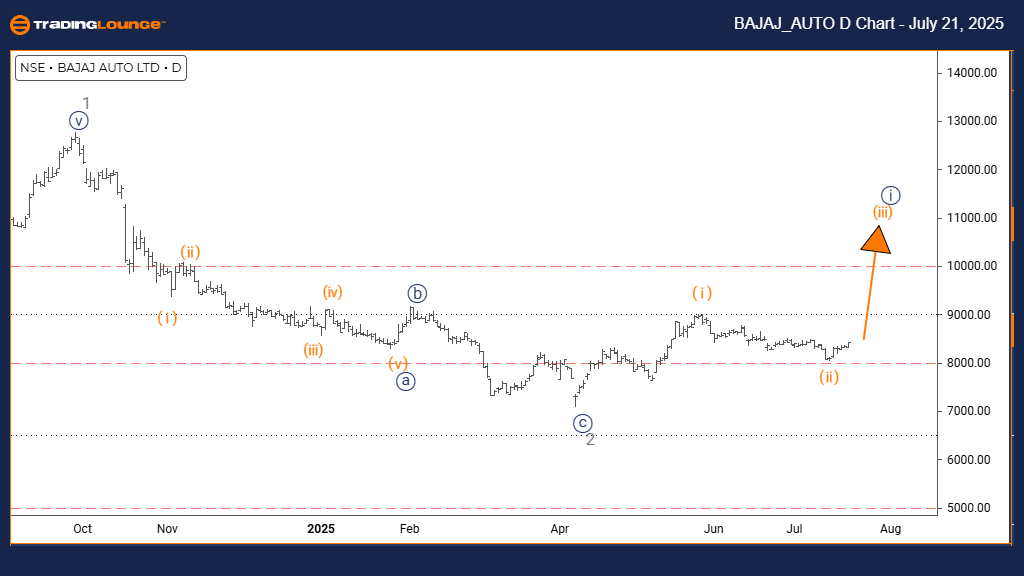
The daily Elliott Wave analysis for BAJAJ AUTO indicates a bullish trend supported by impulsive wave formation. The current chart structure highlights the development of Orange Wave 3 within the larger formation of Navy Blue Wave 1, which signifies that the stock is entering one of the most dynamic stages of the Elliott Wave progression. Observations confirm the completion of Orange Wave 2’s correction, and price action has now moved into Orange Wave 3 — typically the most forceful wave in a bullish trend.
The impulsive mode displays strong upward momentum, marked by consistent higher highs, reflecting sustained demand—likely from institutional buying. As part of Navy Blue Wave 1, Orange Wave 3 is anticipated to carry notable upside movement. This scenario reflects a transition from corrective behavior into a new impulsive wave, presenting potentially significant trading opportunities.
This analysis confirms a strong trending environment, where third waves often yield the most noticeable price actions within the Elliott Wave cycle. Traders should track the development of Orange Wave 3 closely, as these waves often attract increased volume and broader market participation. The start of Orange Wave 3 after completing Wave 2 indicates a point where bullish momentum is expected to accelerate.
From a daily perspective, the current movement offers insight into the stock’s position in a broader bullish cycle. There is potential for further price expansion before hitting significant resistance levels. This Elliott Wave interpretation helps traders align strategies with the prevailing upward trend and prepare for potential pullbacks. The present wave’s impulsive characteristics reflect strong demand, suggesting further upside in the near term.
BAJAJ AUTO Elliott Wave Analysis – Trading Lounge Weekly Chart
BAJAJ AUTO Elliott Wave Technical Analysis
FUNCTION: Bullish Trend
MODE: Impulsive
STRUCTURE: Navy Blue Wave 1
POSITION: Gray Wave 3
DIRECTION OF HIGHER DEGREES: Navy Blue Wave 2
DETAILS: The correction in Gray Wave 2 appears complete. Now, Navy Blue Wave 1 of 3 is underway.
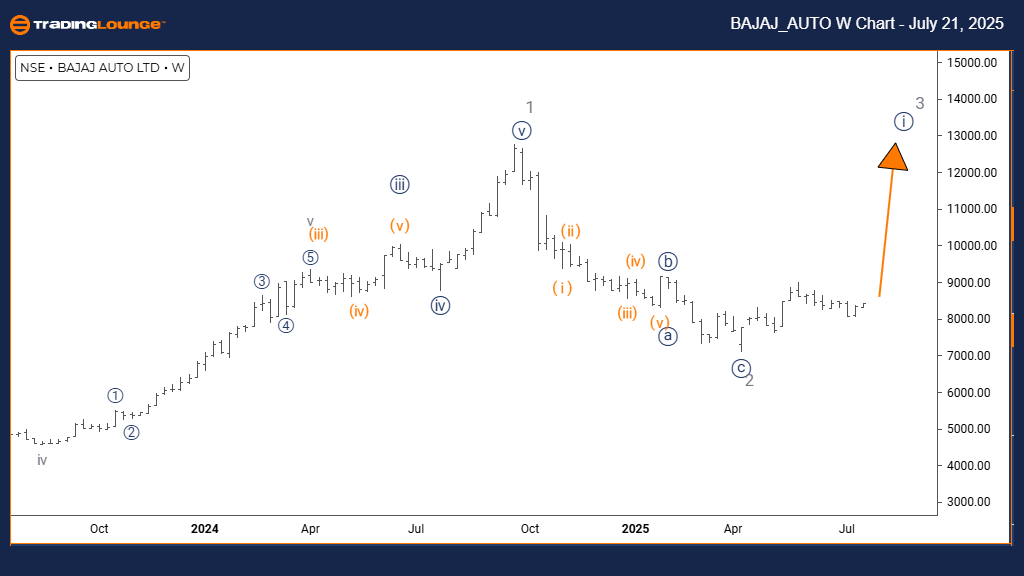
The weekly Elliott Wave analysis of BAJAJ AUTO shows a bullish market environment driven by a clear impulsive wave structure. Currently, Navy Blue Wave 1 is developing within a larger Gray Wave 3 formation, indicating the early stages of a powerful Elliott Wave phase. Technical signals support the conclusion that Gray Wave 2 has ended, with the market transitioning into Navy Blue Wave 1 — the initial leg of what could evolve into a significant upward trend.
This impulsive pattern reflects strong upward momentum, highlighted by successive higher highs. This trend points to consistent buying interest, most likely from institutional traders. As part of Gray Wave 3, Navy Blue Wave 1 is expected to initiate the advance, providing early bullish movement before additional waves develop. The shift from correction to impulse suggests BAJAJ AUTO is now positioned for possible substantial gains.
The weekly chart highlights the current trend’s durability and potential for continuation. Once Navy Blue Wave 1 completes, the next movement is expected to be Navy Blue Wave 2 — a corrective pullback commonly following an initial impulse. Traders should watch the progress of Navy Blue Wave 1 to prepare for this next phase.
This analysis gives traders a structured perspective of the stock’s place in its broader trend cycle. The price action shows early signs of a more extended upward move, supported by the impulsive wave structure and underlying institutional demand. The weekly wave layout helps align trading approaches with the prevailing bullish trend and prepares for critical wave transitions. The trend remains positive as the stock continues to form higher highs and higher lows within the Elliott Wave sequence.
Technical Analyst: Malik Awais
More By This Author:
ASX Trading: BHP Group Ltd. Analysis & Forecast, July 21
Elliott Wave Technical Forecast: Newmont Corporation - Friday, July 18
U.S. Stocks: Rigetti Computing Inc.
At TradingLounge™, we provide actionable Elliott Wave analysis across over 200 markets. Access live chat rooms, advanced AI & algorithmic charting tools, and curated trade ...
more

