
ASX: NEWMONT CORPORATION - NEM
Elliott Wave Technical Analysis
Today’s Elliott Wave analysis covers the Australian Stock Exchange listing of NEWMONT CORPORATION (ASX:NEM). Based on our evaluation, ASX:NEM is progressing in wave three. This analysis includes detailed price targets and key invalidation levels, helping traders recognize when the trend remains valid or when it may reverse.
ASX: NEWMONT CORPORATION - NEM
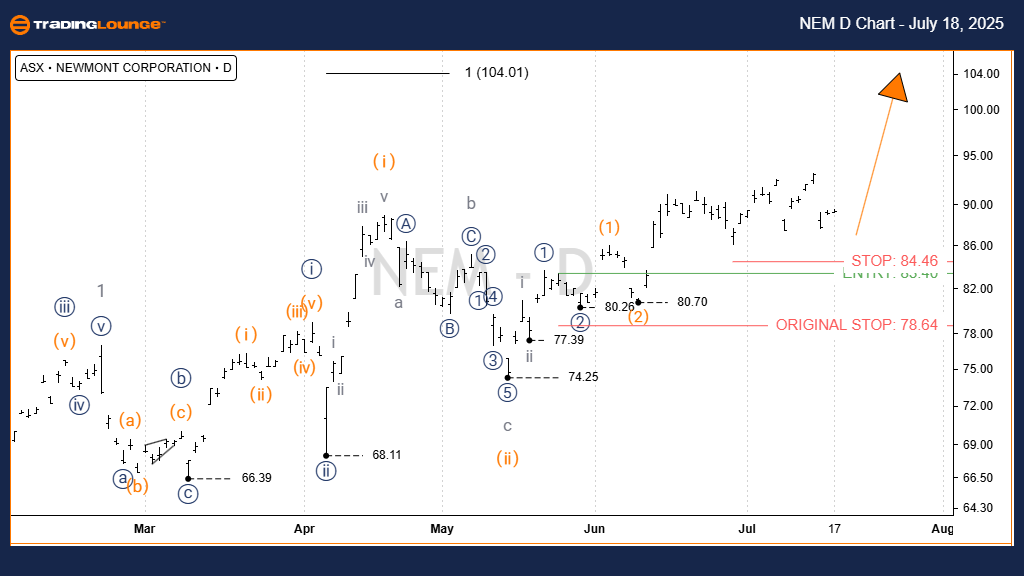
Elliott Wave Technical Analysis (1D Semilog Chart)
Function: Major trend (Minor degree, grey)
Mode: Motive
Structure: Impulse
Position: Wave iii) orange of Wave iii)) navy of Wave 3 grey
Details:
Wave ii) orange likely ended near the 74.25 low as a zigzag pattern labeled a-b-c (grey). Since then, wave iii) orange has advanced upward, targeting a high near 100.00.
Invalidation Point: 74.25
ASX: NEWMONT CORPORATION - NEM
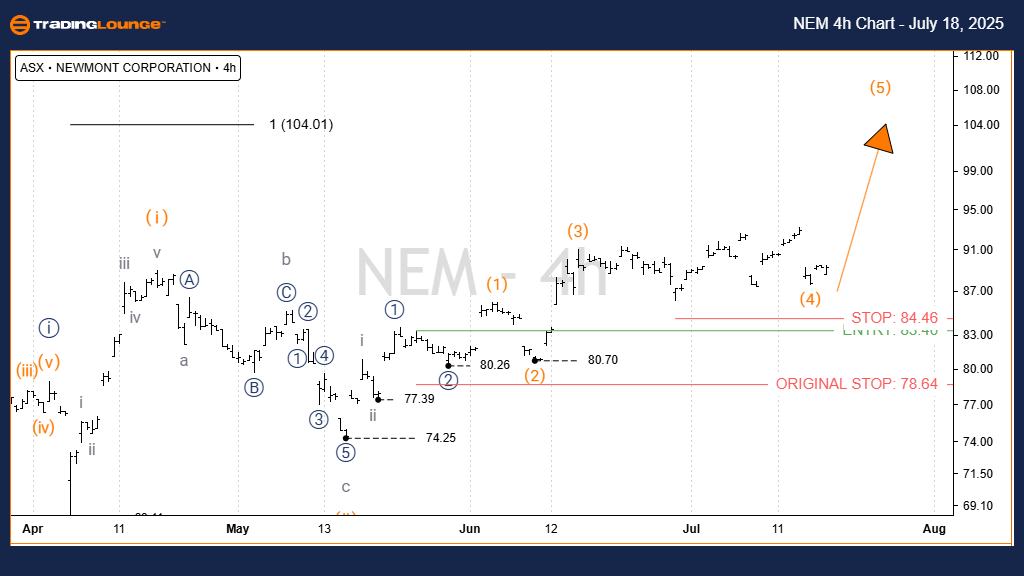
Elliott Wave Technical Analysis (4-Hour Chart)
Function: Major trend (Minor degree, grey)
Mode: Motive
Structure: Impulse
Position: Wave iii) orange of Wave ((iii)) navy of Wave 3 grey
Details:
The 4-hour chart continues to support the 1D view. Wave iii) orange remains in progress toward the 100.00 mark. Additionally, a shorter-term wave iii grey is aiming for a target near 90.00.
Invalidation Point: 74.25
Conclusion
Our current analysis of ASX:NEM provides insight into long-term and short-term market trends. Price levels for validation and invalidation enhance the accuracy of the wave count. This approach allows traders to make decisions based on clearer, more actionable information.
Analyst: Hua (Shane) Cuong, Certified Elliott Wave Analyst - Master (CEWA-M)
More By This Author:
Unlocking ASX Trading Success: Amcor
U.S. Stocks - Micron Technology Inc
Elliott Wave Technical Analysis: British Pound/U.S. Dollar - Thursday, July 17


Comments
Log in or sign up to join the conversation.