
GBPUSD Elliott Wave Analysis – Trading Lounge
British Pound / U.S. Dollar (GBPUSD) – Day Chart
GBPUSD Elliott Wave Technical Review
FUNCTION: Counter Trend
MODE: Corrective
STRUCTURE: Navy Blue Wave 4
POSITION: Gray Wave 1
DIRECTION NEXT HIGHER DEGREES: Navy Blue Wave 5
DETAILS: Navy Blue Wave 3 appears completed. Navy Blue Wave 4 is currently in play.
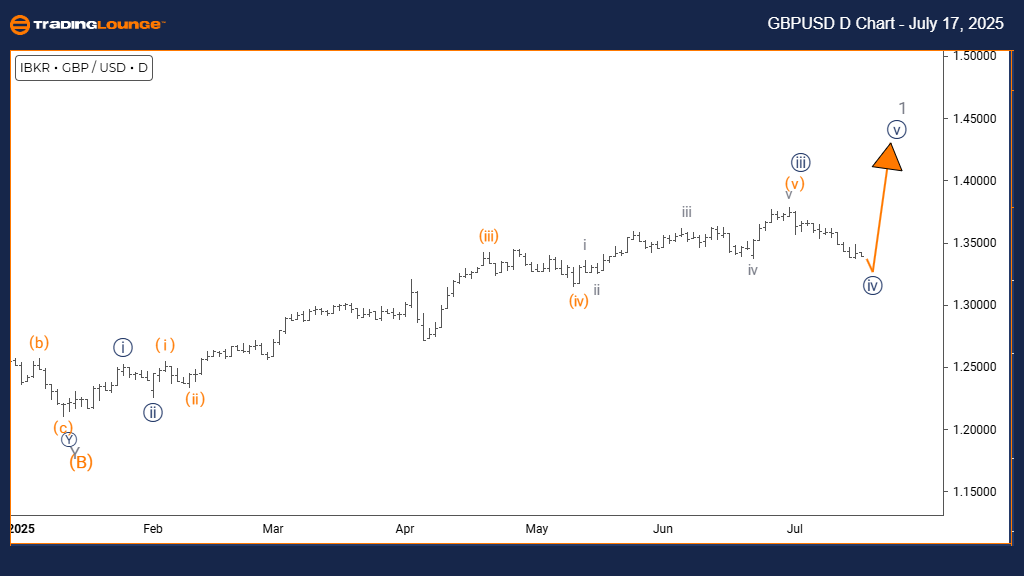
The daily Elliott Wave analysis for GBPUSD shows the currency pair is moving through a counter-trend correction. Navy Blue Wave 4 is unfolding within a broader Gray Wave 1 framework, signaling a short-term retracement after the prior impulsive move completed with Navy Blue Wave 3.
This consolidation suggests reduced market momentum and possible sideways trading. These movements typically correct a portion of the previous wave's gains, offering a pause before the trend resumes. The correction occurs inside a larger trend environment, providing context for its likely temporary nature.
Once Navy Blue Wave 4 ends, the chart anticipates the emergence of Navy Blue Wave 5, which should conclude this sequence. Traders should watch for signs indicating this wave’s exhaustion to prepare for the next movement. Until completion, expect muted price directionality as the structure continues to form.
This setup outlines the pair’s position within the broader cycle. The daily view helps traders stay patient and focused during correction, preparing for renewed movement aligned with the main trend. The structure reflects a temporary break in an otherwise upward market context.
British Pound / U.S. Dollar (GBPUSD) – 4-Hour Chart
GBPUSD Elliott Wave Technical Review
FUNCTION: Counter Trend
MODE: Corrective
STRUCTURE: Navy Blue Wave 4
POSITION: Gray Wave 1
DIRECTION NEXT HIGHER DEGREES: Navy Blue Wave 5
DETAILS: Navy Blue Wave 3 appears completed. Navy Blue Wave 4 is currently in motion.
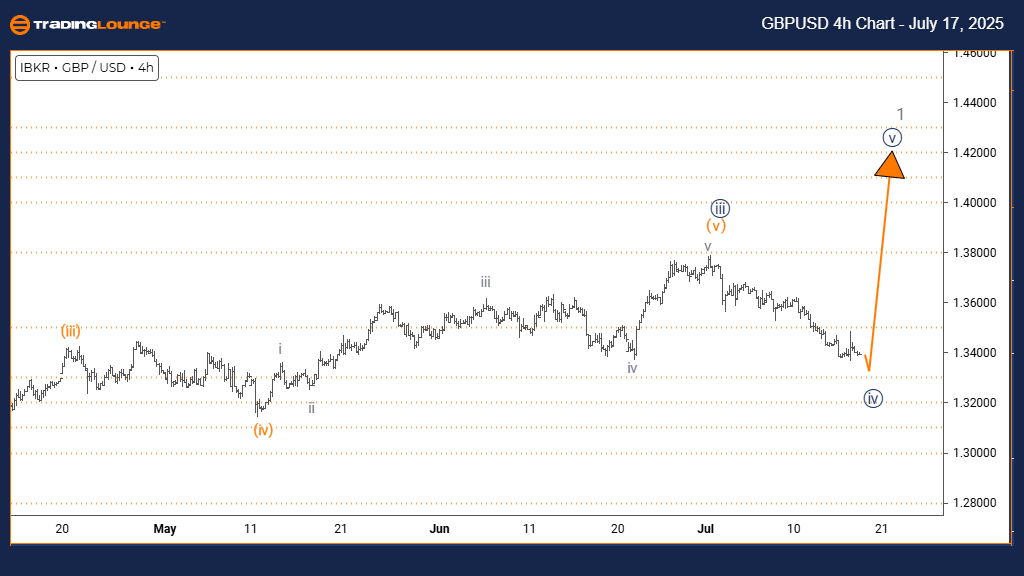
The 4-hour Elliott Wave analysis for GBPUSD identifies a counter-trend correction phase. The currency pair is currently forming Navy Blue Wave 4 within a larger Gray Wave 1 structure. This implies the market is pausing after an impulsive upward movement concluded at Navy Blue Wave 3.
This wave often leads to subdued price action, either sideways or shallow retracements. Following this, the development of Navy Blue Wave 5 is anticipated, representing the final leg in the current cycle. The existing structure shows a temporary interruption in the main trend rather than a reversal.
This analytical model aids in forecasting the wave's likely end. Traders should observe for signals indicating the exhaustion of Navy Blue Wave 4. The 4-hour perspective provides detailed short-term insights into the pair’s current behavior within the broader bullish pattern.
The corrective behavior typically means less momentum until the pattern completes. Once it does, price action may accelerate again. This framework allows traders to adapt strategies for a smoother transition into the upcoming impulsive phase.
Technical Analyst: Malik Awais
More By This Author:
Unlocking ASX Trading Success: Amcor
Bitcoin Crypto Price News Today - Thursday, July 17
Global Market Outlook – July 17, 2025


Comments
Log in or sign up to join the conversation.