
Rigetti Computing Inc. (RGTI) Elliott Wave Analysis | Daily Chart
Technical Analysis – Trading Lounge
- FUNCTION: Trend
- MODE: Motive
- STRUCTURE: Impulsive
- POSITION: Wave V
- DIRECTION: Uptrend
Analysis:
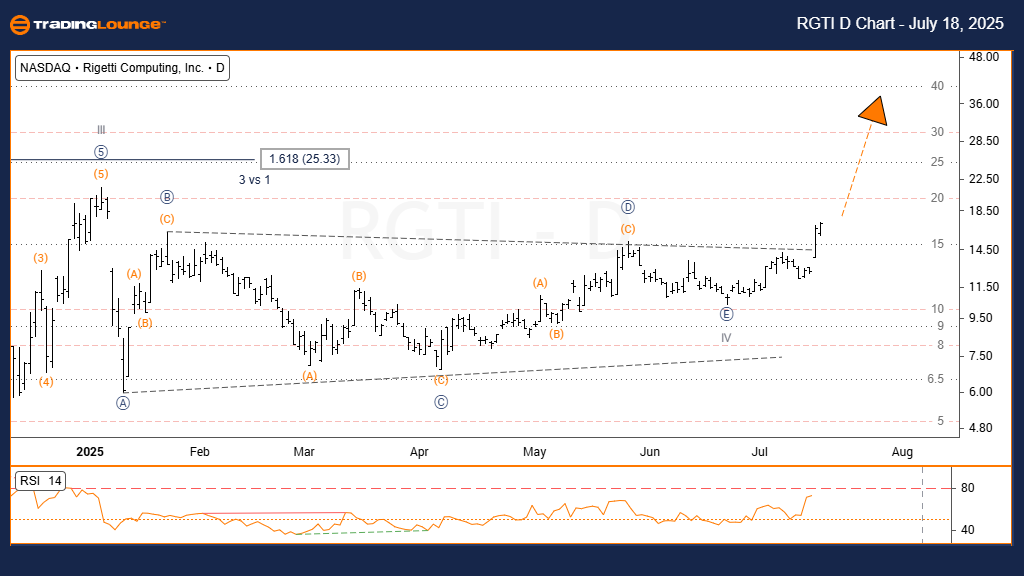
On the daily chart, Rigetti Computing Inc. (RGTI) has broken out from a running triangle pattern, indicating the initiation of Wave V. This move follows a consolidation phase that completed Wave IV. The breakout is accompanied by a rise in momentum and volume—key indicators that support a sustained bullish continuation.
Price is now expected to trend higher, with resistance levels projected between $35 and $45, aligning with the expected move post-triangle breakout. Traders should monitor for follow-through buying to confirm the bullish structure remains intact.
Rigetti Computing Inc. (RGTI) Elliott Wave Analysis | Weekly Chart
Technical Analysis – Trading Lounge
- FUNCTION: Trend
- MODE: Motive
- STRUCTURE: Impulsive
- POSITION: Wave V
- DIRECTION: Uptrend
Analysis:
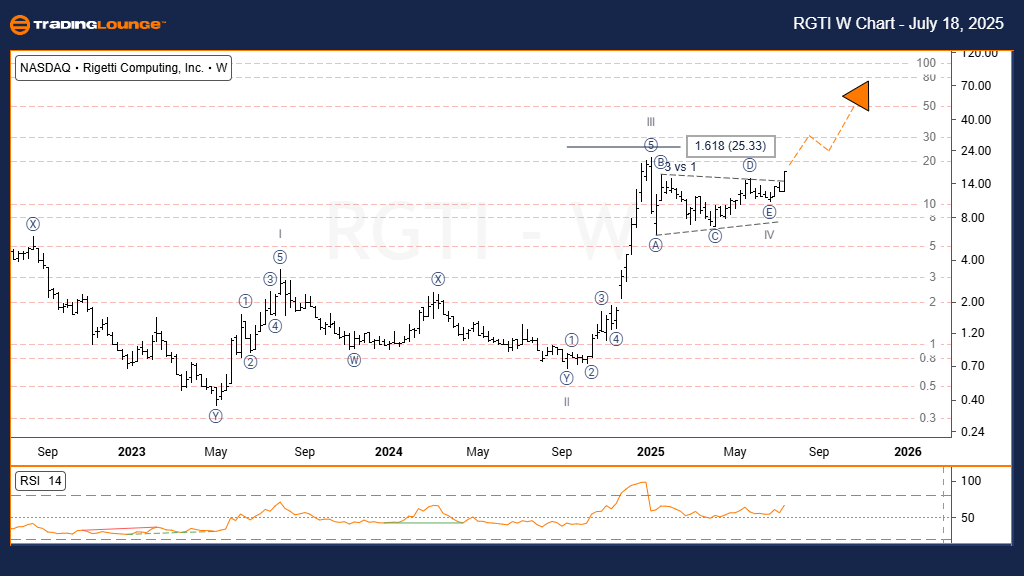
The weekly chart reinforces the bullish view, showing that Wave IV completed as a contracting triangle, in line with Elliott Wave alternation principles (as Wave II was a sharp move). The early July breakout above the triangle boundary marks the beginning of Wave V, which is now in progress.
Targets:
- Initial resistance around $40
- Potential extension to $65, based on a 1.618 Fibonacci projection of Wave I from the Wave IV low
This structure remains valid as long as the price stays above the Wave IV low.
Technical Analyst: Dhiren Pahuja
More By This Author:
Elliott Wave Technical Forecast: Newmont Corporation - Friday, July 18
Elliott Wave Technical Analysis: Australian Dollar/U.S. Dollar - Friday, July 18
Chainlink /U.S. Dollar Crypto Price News Today


Comments
Log in or sign up to join the conversation.