
Indian Stocks Axis Bank
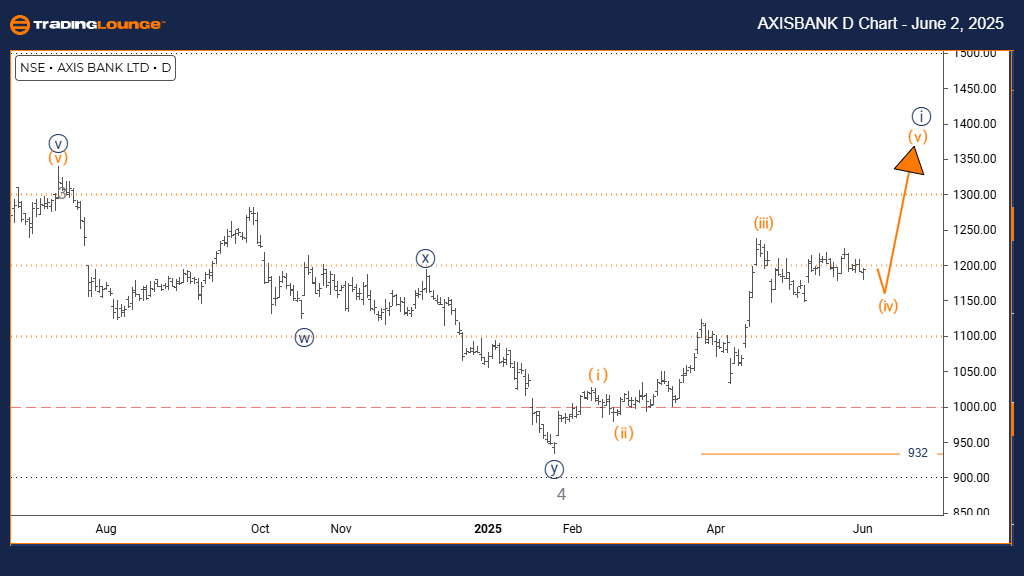
Axis Bank Elliott Wave Analysis – Trading Lounge Day Chart
Axis Bank Elliott Wave Technical Overview
- Function: Trend
- Mode: Impulsive
- Structure: Navy Blue Wave 1
- Position: Gray Wave 5
- Next Lower Degree Direction: Navy Blue Wave 2
- Details: Gray wave 4 is likely completed; navy blue wave 1 of 5 is currently forming. Invalidation level: 932
Market Overview
The Axis Bank daily chart displays strong bullish momentum, indicating entry into the final phase of its current upward structure. Navy blue wave one is forming within gray wave five, marking a new impulse phase. This wave structure implies that the stock is progressing through the last advancing leg before facing a potential trend change or significant correction.
Implications and Risk Strategy
The transition from gray wave four to navy blue wave one shows strong buying activity. However, as this is the concluding wave of the cycle, traders should watch for signs of weakening momentum. If the price drops below 932, it could invalidate the current count and signal a reassessment.
Outlook for Traders
Axis Bank could experience another push upward before the larger cycle concludes. Traders should look for signs like momentum divergence that commonly appear at the end of fifth waves. Positioning strategies should focus on short-term opportunities with risk controls in place.
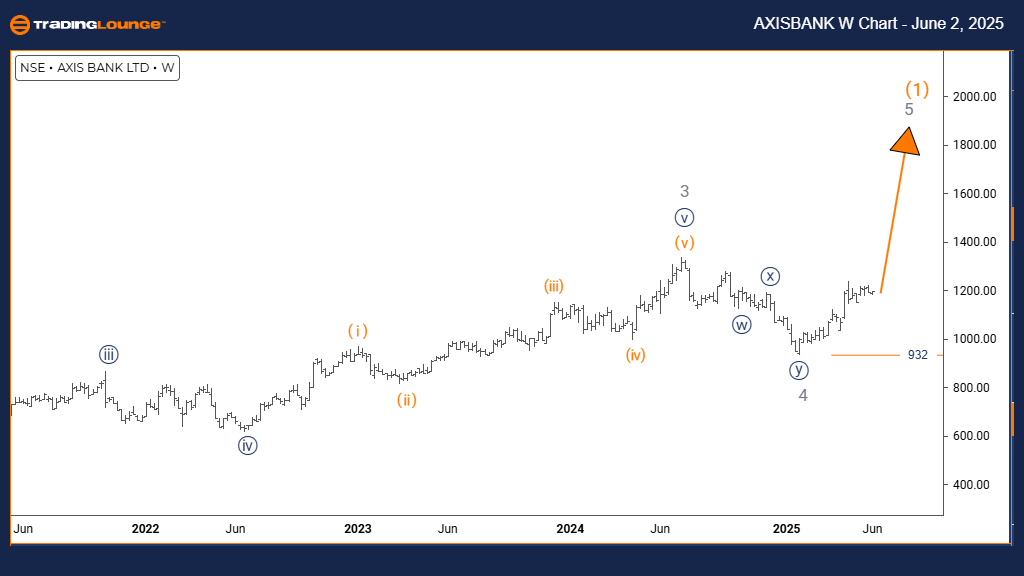
Axis Bank Elliott Wave Analysis – Trading Lounge Weekly Chart
Axis Bank Elliott Wave Technical Overview
- Function: Trend
- Mode: Impulsive
- Structure: Gray Wave 5
- Position: Orange Wave 1
- Next Higher Degree Direction: Gray Wave 5
- Details: Gray wave 4 seems completed; gray wave 5 is now in progress. Invalidation level: 932
Long-Term Market View
The weekly chart analysis places Axis Bank in the final phase of its bullish Elliott Wave cycle. Gray wave five has emerged, indicating the final upward movement following gray wave four's correction. This suggests limited upside may remain before a potential reversal.
Trend Implications
The impulsive behavior of gray wave five indicates continued buying strength, though signs of weakening may appear as the move nears completion. A drop below 932 would invalidate the wave count, potentially requiring a new assessment of the structure.
Investor Focus
Traders and investors should monitor momentum indicators and wave behavior for signals of exhaustion. While the current setup supports a continued upward trend, awareness of completion signs is essential for timely strategy adjustments.
Technical Analyst: Malik Awais
More By This Author:
Unlocking ASX Trading Success: Insurance Australia Group Limited - Monday, June 2
Elliott Wave Technical Analysis: British Pound/Australian Dollar - Monday, June 2
Elliott Wave Technical Analysis VeChain Crypto Price News
At TradingLounge™, we provide actionable Elliott Wave analysis across over 200 markets. Access live chat rooms, advanced AI & algorithmic charting tools, and curated trade ...
more

