
GBPAUD Elliott Wave Analysis – Trading Lounge
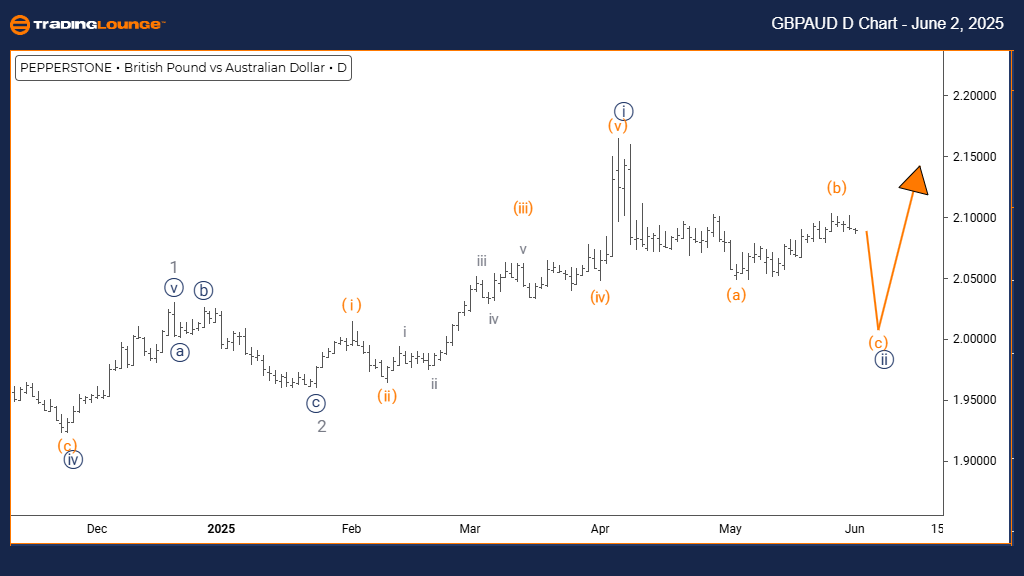
British Pound / Australian Dollar (GBPAUD) – Day Chart
GBPAUD Elliott Wave Technical Overview
- Function: Counter-Trend
- Mode: Corrective
- Structure: Navy Blue Wave 2
- Position: Gray Wave 3
- Next Higher Degree Direction: Navy Blue Wave 3
- Details: Navy Blue Wave 1 appears completed; Navy Blue Wave 2 is currently unfolding.
Current Technical View
The daily chart for GBPAUD reflects a counter-trend corrective movement within a broader bullish market context. The analysis identifies the emergence of navy blue wave two, which follows the completion of navy blue wave one, and forms part of the ongoing gray wave three. This setup points to a temporary retracement before the uptrend potentially resumes.
Corrective Phase and Market Implications
Evidence suggests navy blue wave one has wrapped up, giving way to a corrective decline marked as navy blue wave two. While this correction suggests limited downside, the overall structure remains bullish. Unless critical support zones are violated, the likely outcome is an upward continuation in navy blue wave three. This insight helps forex traders gauge where the pair stands within the overall trend.
Trader Guidance and Market Forecast
As GBPAUD completes this corrective phase, increased volatility is expected. Navy blue wave two represents a pause in the broader upward trend. Traders should observe the price action closely for signs of wave two’s conclusion, which could mark the start of wave three’s bullish move. The current wave pattern provides a guide for interpreting both the short-term correction and the longer-term bullish momentum.
Maintaining alertness to new technical patterns is key, as these may clarify the pair’s next direction. Traders are advised to use disciplined risk management due to the evolving wave scenario. The current decline is identified as part of a corrective wave rather than the start of a downtrend, hinting at renewed upward potential once the wave two correction ends.
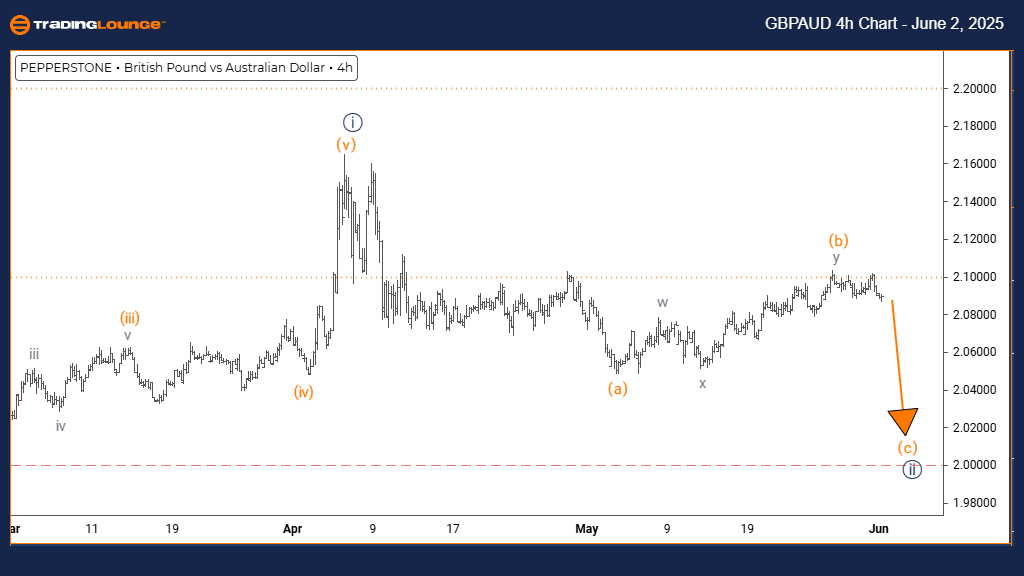
British Pound / Australian Dollar (GBPAUD) – 4 Hour Chart
GBPAUD Elliott Wave Technical Overview
- Function: Counter-Trend
- Mode: Impulsive
- Structure: Orange Wave C
- Position: Navy Blue Wave 2
- Next Higher Degree Direction: Navy Blue Wave 3
- Details: Orange Wave B appears complete; Orange Wave C of 2 is currently forming.
Current Market Scenario
On the 4-hour chart, GBPAUD displays a counter-trend setup with impulsive characteristics within a larger correction. The chart reveals the emergence of orange wave C as part of the ongoing navy blue wave two structure. This signals that orange wave B’s retracement phase has ended, and the final leg of the correction—orange wave C—has started its downward progression.
Technical Implications and Market Behavior
The transition from orange wave B to C suggests increasing downward pressure, yet within a corrective pattern rather than a full-scale downtrend. The impulsive move in wave C indicates short-term bearishness, but overall, the structure implies a temporary phase. This is crucial for traders to interpret the ongoing decline as part of a setup that still supports an eventual bullish continuation in navy blue wave three.
Outlook and Trading Strategy
Ongoing weakness in GBPAUD is expected to persist as wave C continues to develop. However, this movement is contained within the broader correction. Traders should watch for indicators signaling the end of wave C, as this could mark the conclusion of navy blue wave two and the beginning of an upward reversal. Recognizing potential support and reversal areas is key to leveraging this structure effectively.
This analysis provides essential guidance for forex traders navigating this complex corrective wave. While the current trend is downward, the overall structure remains bullish post-correction, emphasizing the need for disciplined trade setups and continuous monitoring.
Technical Analyst: Malik Awais
More By This Author:
SP500, Nasdaq , Bitcoin & Top Tech Stocks Analysis
Indian Stocks - Kotak Bank
Elliott Wave Technical Analysis VanEck Semiconductor ETF


Comments
Log in or sign up to join the conversation.