
SMH Elliott Wave Analysis – Trading Lounge
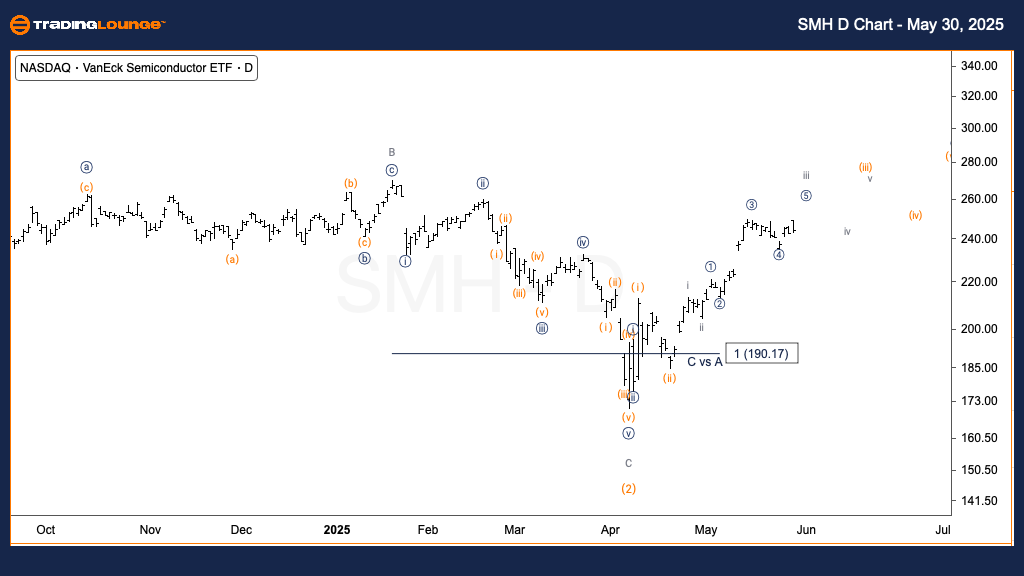
VanEck Semiconductor ETF (SMH) – Daily Chart
SMH Elliott Wave Technical Analysis
FUNCTION: Trend
MODE: Impulsive
STRUCTURE: Motive
POSITION: Wave iii of (iii)
DIRECTION: Upside in wave (iii)
DETAILS:
SMH is advancing in a strong impulsive structure, forming a sequence of higher degree wave threes and fours. As the ETF approaches the $250 mark, the trend remains upward with the next significant resistance projected at TradingLevel3 ($300). The formation supports sustained bullish momentum within wave (iii).
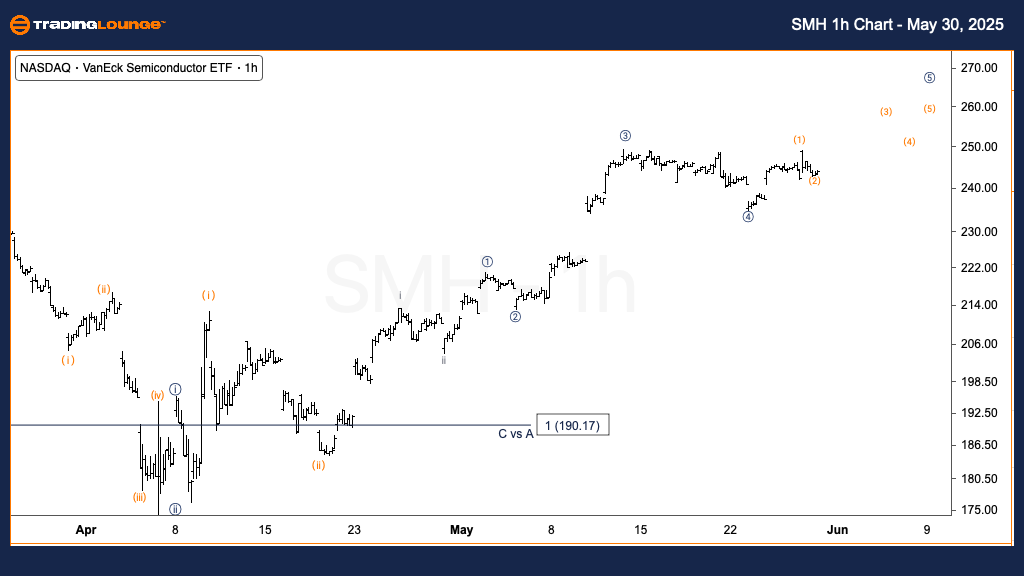
VanEck Semiconductor ETF (SMH) – 1H Chart
SMH Elliott Wave Technical Analysis
FUNCTION: Trend
MODE: Impulsive
STRUCTURE: Motive
POSITION: Wave 5 of iii
DIRECTION: Upside in wave iii
DETAILS:
On the 1-hour chart, SMH appears to be completing micro wave 5 of wave iii. If the structure avoids truncation, there is room for additional upside in this final leg of the impulse. Afterward, a corrective wave iv is expected before wave v resumes the broader trend higher.
Analysis Summary:
This Elliott Wave analysis of SMH highlights a clear impulsive uptrend across both timeframes. The daily chart projects movement toward the $300 level, while the 1-hour chart suggests further near-term gains within micro wave 5 before a potential minor correction. Traders should monitor for reversal signals near short-term peaks and prepare for continued bullish movement after brief pullbacks.
Technical Analyst: Alessio Barretta
More By This Author:
Elliott Wave Technical Analysis VeChain Crypto Price News Today
S&P/TSX 60 Index Elliott Wave Technical Forecast
Indian Stocks Kotak Bank


Comments
Log in or sign up to join the conversation.