
KOTAK BANK Elliott Wave Analysis – Trading Lounge Day Chart
KOTAK BANK Elliott Wave Technical Analysis
FUNCTION: Counter Trend
MODE: Corrective
STRUCTURE: Orange Wave 2
POSITION: Navy Blue Wave 3
DIRECTION NEXT HIGHER DEGREES: Orange Wave 3
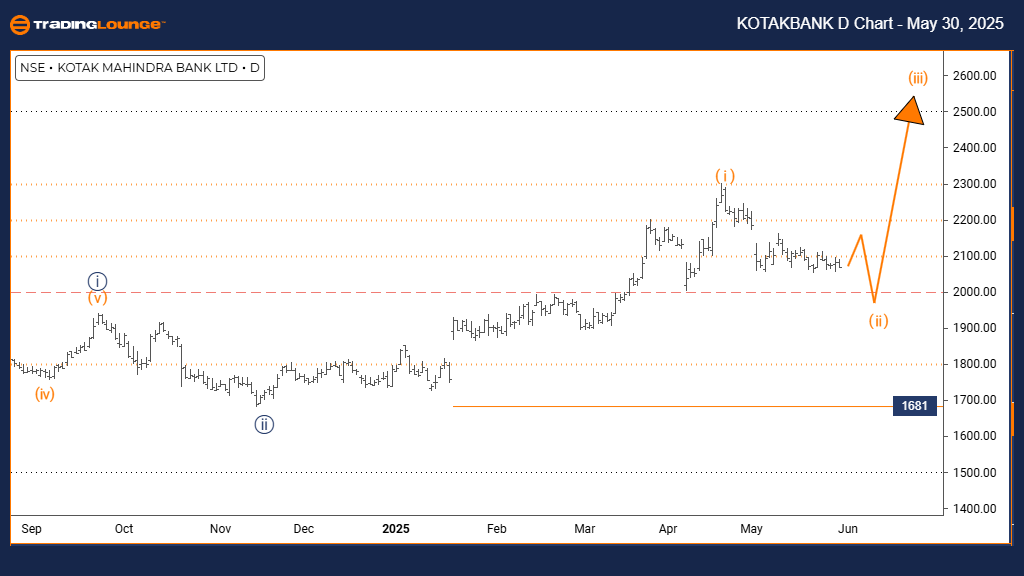
DETAILS: Orange Wave 1 appears complete; Orange Wave 2 is now developing.
Wave cancel/invalidation level: 1681
The daily chart reveals Kotak Bank is in a corrective counter-trend phase within a broader market structure. Orange Wave 2 is unfolding as part of a larger bearish move under Navy Blue Wave 3. This suggests the prior downtrend (Orange Wave 1) has paused temporarily.
The chart confirms Orange Wave 1 is complete, and the stock is currently in a corrective bounce via Orange Wave 2. The upside during this phase is likely limited. A breach above 1681 would invalidate this wave count and indicate a possible shift in trend or a more complex correction.
Traders should monitor closely for signs of completion in Orange Wave 2, as this would signal the beginning of a new bearish leg in Orange Wave 3. This setup offers a framework to manage trades during a corrective window while preparing for the next downward phase.
KOTAK BANK Elliott Wave Analysis – Trading Lounge Weekly Chart
KOTAK BANK Elliott Wave Technical Analysis
FUNCTION: Counter Trend
MODE: Corrective
STRUCTURE: Orange Wave 2
POSITION: Navy Blue Wave 3
DIRECTION NEXT HIGHER DEGREES: Orange Wave 3
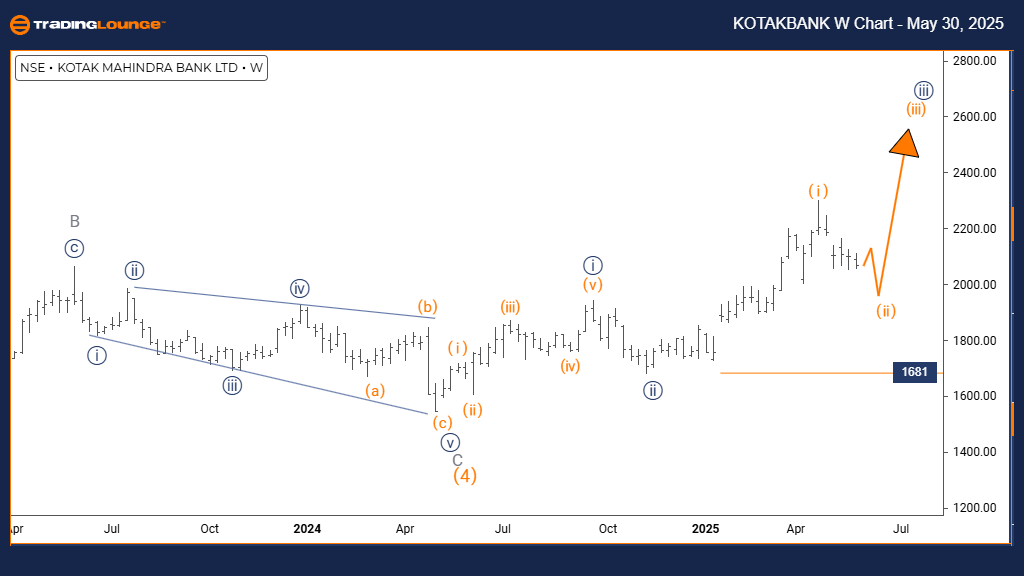
DETAILS: Orange Wave 1 appears complete; Orange Wave 2 is now in progress.
Wave cancel/invalidation level: 1681
The weekly chart analysis positions Kotak Bank in a counter-trend corrective structure. The unfolding of Orange Wave 2 within the larger Navy Blue Wave 3 sequence suggests the stock has paused after completing its initial downward move.
This indicates a retracement is taking place rather than a new upward trend. The current move should be viewed as a corrective bounce with limited potential. If the price breaches the 1681 level, the current wave count becomes invalid, possibly pointing to a trend reversal or an extended correction.
Investors should be aware that this is a complex counter-trend structure and prepare for potential downside once Orange Wave 2 concludes. Proper risk controls and awareness of reversal zones are essential to managing exposure during this stage.
Technical Analyst: Malik Awais
More By This Author:
Elliott Wave Technical Forecast: Newmont Corporation - Thursday, May 29
Elliott Wave Technical Analysis: CSX Corp. - Thursday, May 29
Elliott Wave Technical Analysis: Euro/British Pound - Thursday, May 29


Comments
Log in or sign up to join the conversation.