
EURGBP Elliott Wave Analysis – Trading Lounge
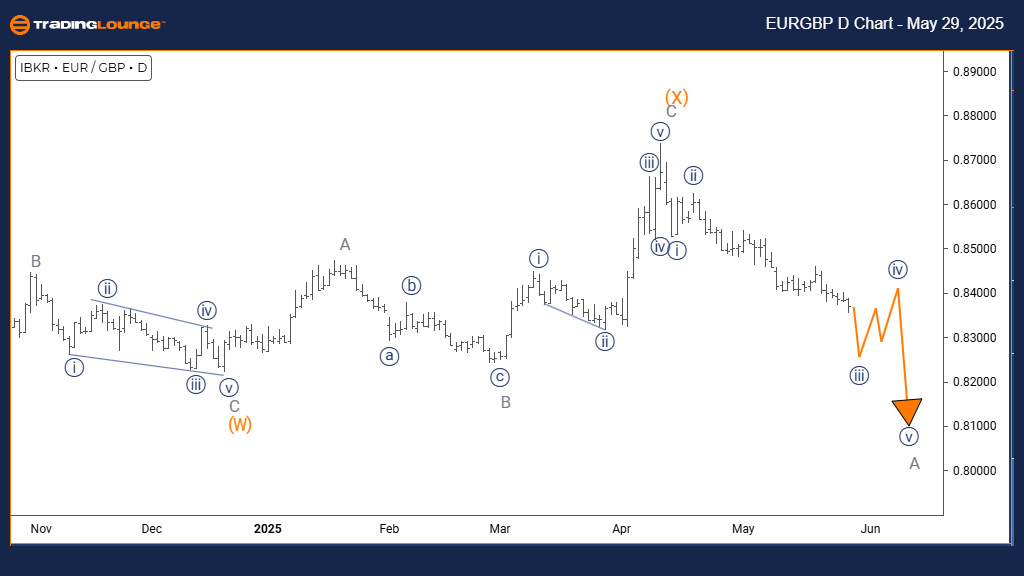
Euro/British Pound (EURGBP) Day Chart
EURGBP Elliott Wave Technical Analysis
- Function: Counter Trend
- Mode: Impulsive
- Structure: Navy Blue Wave 3
- Position: Gray Wave A
- Direction (Next Higher Degree): Navy Blue Wave 4
- Details: Completion of Navy Blue Wave 2; Navy Blue Wave 3 is now active.
Technical Overview
The EURGBP daily chart presents a counter-trend scenario featuring impulsive wave behavior within a broader corrective framework. The current technical structure indicates that Navy Blue Wave 3 is developing within Gray Wave A, marking the end of the corrective Navy Blue Wave 2. This transition confirms the beginning of a downward impulse phase.
Market Behavior
Analysis suggests that the completion of Navy Blue Wave 2 has led to a developing Navy Blue Wave 3, showing strong downward momentum. The movement remains part of a corrective pattern and not a new long-term bearish trend. This setup gives traders insight into the currency pair’s position within a complex correction and highlights the nature of the current price action.
Trading Implications
The wave structure implies continued downside during this counter-trend phase. Traders should anticipate further declines until Wave 3 concludes, after which a Wave 4 correction is likely. While this movement is significant, it still fits within the context of a broader correction, not a fresh trend. Monitoring this wave’s development is crucial for identifying trade entries and exits with effective risk management.
This Elliott Wave perspective provides valuable context for navigating the counter-trend setup and preparing for possible short-term bearish moves before the longer-term trend resumes.
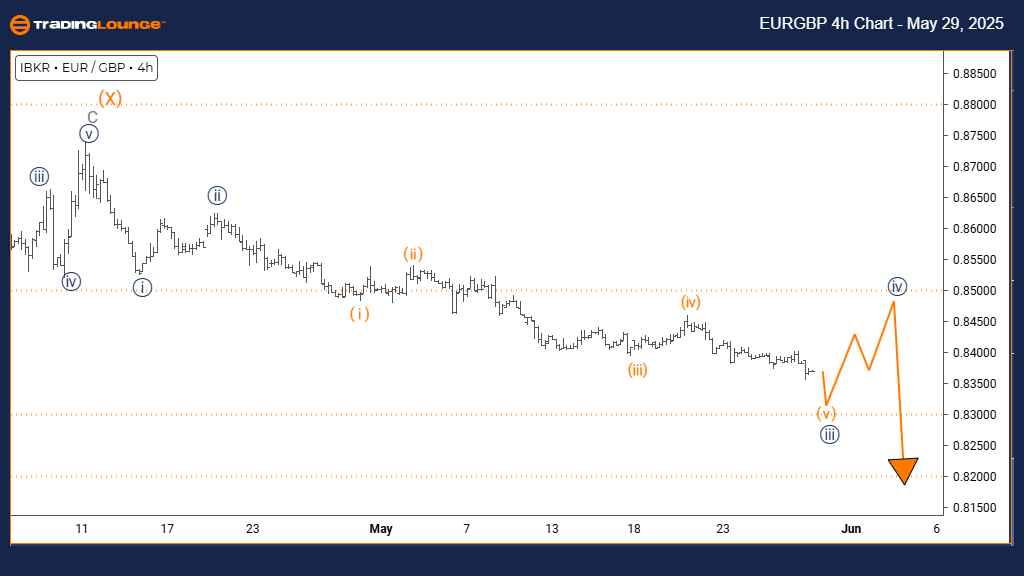
Euro/British Pound (EURGBP) 4 Hour Chart
EURGBP Elliott Wave Technical Analysis
- Function: Bearish Trend
- Mode: Impulsive
- Structure: Orange Wave 5
- Position: Navy Blue Wave 3
- Direction (Next Higher Degree): Navy Blue Wave 4
- Details: Orange Wave 4 appears completed; Orange Wave 5 is underway.
Technical Overview
The EURGBP 4-hour chart displays a defined bearish trend with strong downside momentum. The chart reveals Orange Wave 5 forming within a broader bearish phase labeled as Navy Blue Wave 3, signaling that Orange Wave 4 has likely ended. This development points to a continuation of the downtrend into the final segment of this impulsive sequence.
Market Behavior
The confirmation of Orange Wave 4’s completion and the emergence of Orange Wave 5 indicate sustained selling pressure. Since this movement lies within Navy Blue Wave 3, the bearish trend appears ongoing, with more room for decline before potential exhaustion. This wave configuration gives forex traders a clear picture of where EURGBP stands within its broader cycle.
Trading Implications
The pattern indicates a possible final leg downward, completing the five-wave sequence. After this, a correction or trend reversal may emerge. Traders should watch for common fifth wave traits, such as momentum divergence or decreasing bearish strength. Recognizing these signs can help identify critical price zones for trend confirmation or reversal.
Although the current wave count supports a bearish bias, traders should stay cautious and observe for signals of pattern completion. This Elliott Wave analysis assists in managing open positions effectively as the trend nears its probable end, emphasizing the need for solid risk controls.
Technical Analyst: Malik Awais
More By This Author:
Elliott Wave Technical Analysis: Ripple Crypto Price News For Thursday, May 29
Unlocking ASX Trading Success: Cochlear Limited - Wednesday, May 28
Elliott Wave Technical Analysis: Caterpillar Inc. - Wednesday, May 28


Comments
Log in or sign up to join the conversation.