
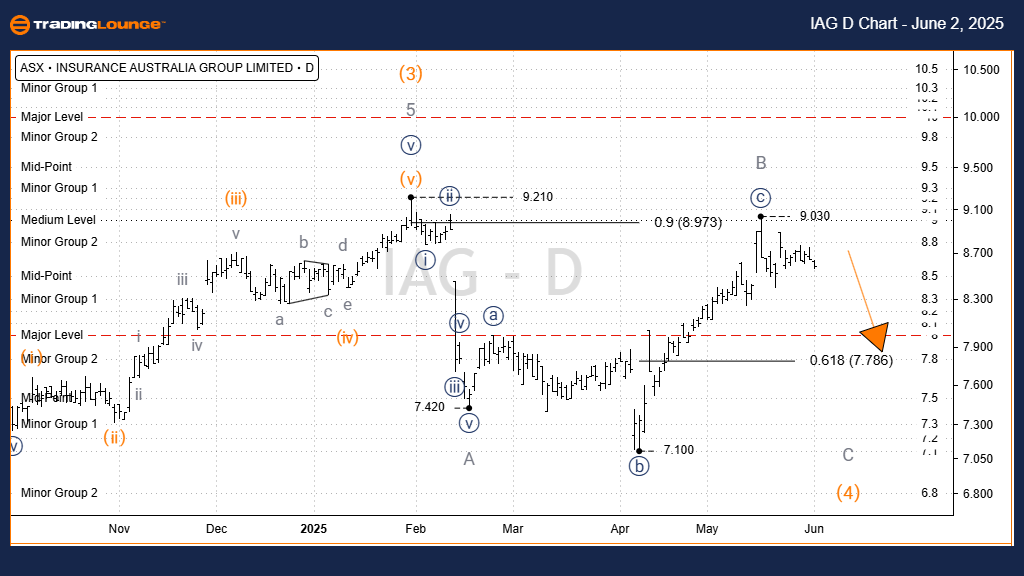
ASX: INSURANCE AUSTRALIA GROUP LIMITED – IAG Elliott Wave Technical Analysis (1-Day Chart)
Function: Major trend (Minor degree, grey)
Mode: Motive
Structure: Impulse
Position: Wave C-grey
Details:
- Wave 3-orange has concluded as a five-wave sequence.
- Wave 4-orange is unfolding downward as a Zigzag labeled A, B, C-grey.
- Wave A-grey has completed.
- Wave B-grey likely completed as an Expanded Flat.
- Wave C-grey is expected to push lower, targeting the 7.79 level.
Invalidation Point: 9.03
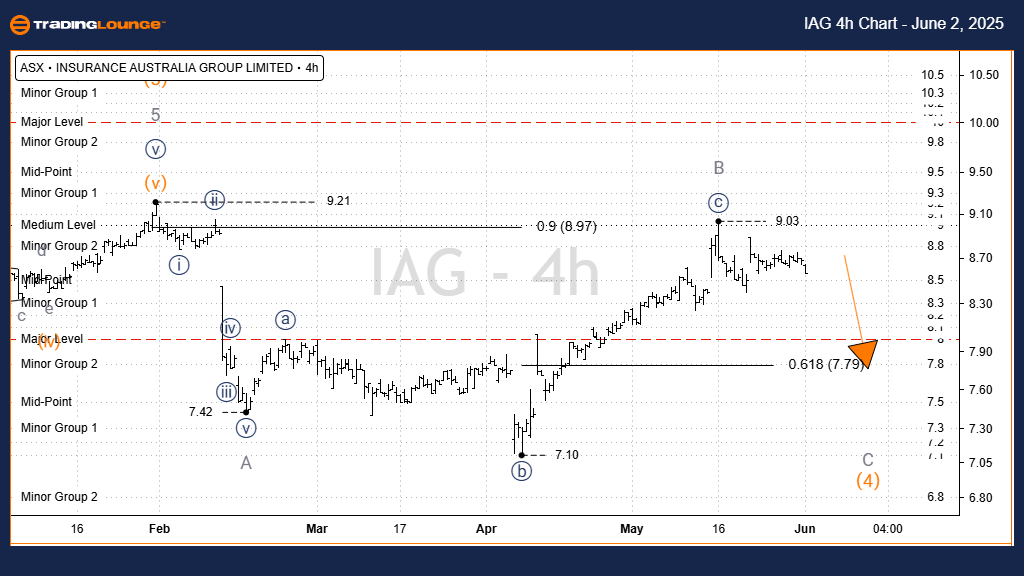
ASX: INSURANCE AUSTRALIA GROUP LIMITED – IAG Elliott Wave Technical Analysis (4-Hour Chart)
Function: Major trend (Minor degree, grey)
Mode: Motive
Structure: Impulse
Position: Wave C-grey
Details:
- A-grey and B-grey waves have completed.
- Since the 9.03 high, a decline is anticipated with the C-grey wave.
- The nearest target is 7.79, with potential further movement to 7.42–7.10.
- Price must remain below 9.03 to maintain this outlook.
Conclusion
Our analysis and short-term forecast for ASX: INSURANCE AUSTRALIA GROUP LIMITED – IAG aim to provide insights into current market trends and effective strategies. Specific price points serve as validation or invalidation signals for our wave count, enhancing confidence in our perspective. By combining these factors, we strive to offer an objective and professional view of market trends.
Technical Analyst: Hua (Shane) Cuong, CEWA-M (Master’s Designation)
More By This Author:
SP500, Nasdaq , Bitcoin & Top Tech Stocks Analysis
Indian Stocks - Kotak Bank
Elliott Wave Technical Analysis VanEck Semiconductor ETF


Comments
Log in or sign up to join the conversation.