
Elliott Wave Analysis - TradingLounge Daily Chart,
Asset: VeChain / U.S. Dollar (VETUSD)
VETUSD Elliott Wave Technical Analysis
- Function: Trend Following
- Mode: Motive
- Structure: Impulse
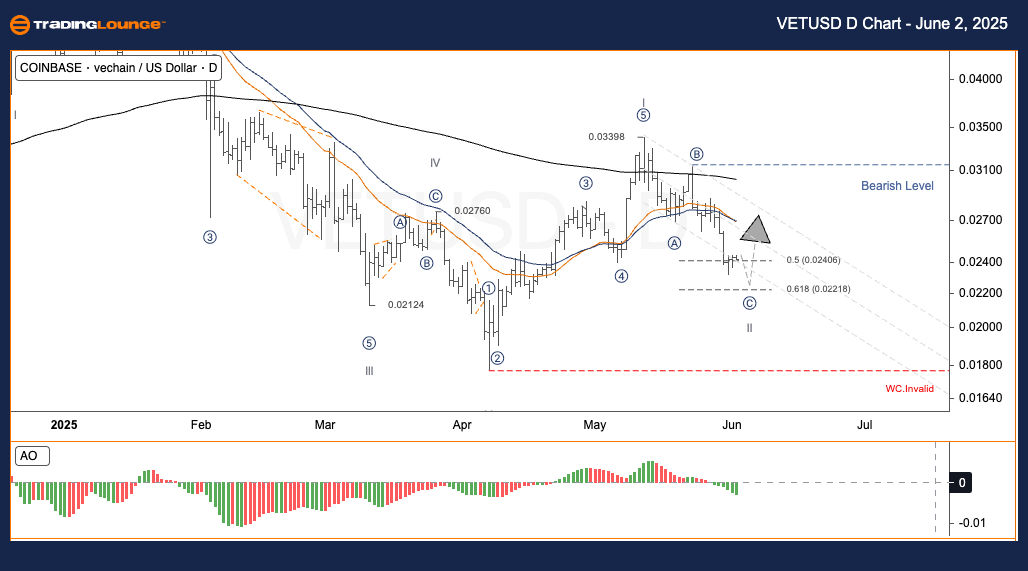
- Position: Wave II
- Direction of Higher Degree: Pending
- Wave Invalid Level: Not Specified
VETUSD Trading Strategy - Daily Chart
Following the major Wave V bottom at $0.0212, VETUSD advanced to $0.0315 during the sub-wave ⑤. This rise marks the beginning of a correction phase labeled A-B-C, signaling a pause in the larger bullish structure.
Currently, VETUSD is nearing the end of wave C. The price is testing a key Fibonacci support area between 0.5–0.618 retracement levels. Historically, this zone often acts as a launchpad for new upward movements after corrections.
Trading Strategies
- For Swing Traders
-
- Look for a dip-buying chance between $0.022 and $0.024 if a reversal signal appears.
- Risk Management
-
- Place a stop-loss order under $0.018 to control risk exposure.
Elliott Wave Analysis - TradingLounge H4 Chart,
Asset: VeChain / U.S. Dollar (VETUSD)
VETUSD Elliott Wave Technical Analysis
- Function: Trend Following
- Mode: Motive
- Structure: Impulse
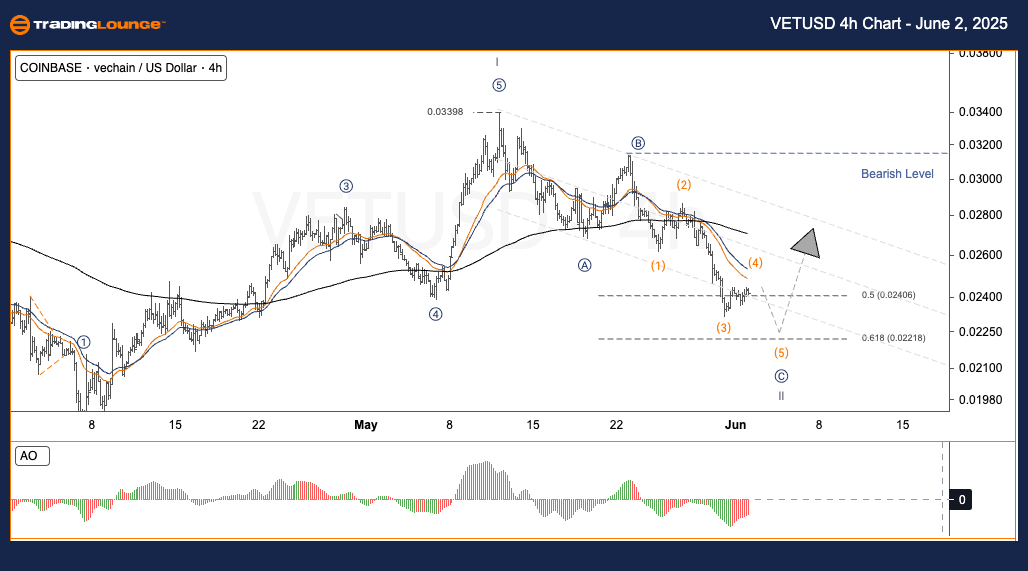
- Position: Wave II
- Direction of Higher Degree: Pending
- Wave Invalid Level: Not Specified
VETUSD Trading Strategy - H4 Chart
VETUSD rose from $0.0212 to $0.0315, ending sub-wave ⑤. Since then, it has entered a corrective A-B-C pattern, aligning with the broader bullish cycle.
As wave C approaches its end, the Fibonacci 0.5–0.618 support zone becomes critical. It is often where market reversals form post-correction.
Trading Strategies
- For Swing Traders
-
- Watch for dip entries in the $0.022–$0.024 range, confirming a reversal pattern.
- Risk Management
-
- A stop-loss below $0.018 is advised to manage potential downside.
Analyst: Kittiampon Somboonsod, CEWA
More By This Author:
SP500, Nasdaq , Bitcoin & Top Tech Stocks Analysis
Indian Stocks - Kotak Bank
Elliott Wave Technical Analysis VanEck Semiconductor ETF


Comments
Log in or sign up to join the conversation.