Gold Bottoms As The Bank Of England Pivots To Quantitative Easing
Across the globe, we have had years and years of quantitative easing (QE) by central banks, who have poured billions into buying mortgages and bonds in an attempt to increase the liquidity to enable the world economies to prosper. Along with interest rates being held down at historically low levels, the result has produced an inflationary environment.

- The US, UK and Europe now report ‘official’ inflationary figures at around 9% to 10%.
- The Bank of England blinks and purchasers more bonds, which could herald in a new phase of quantitative easing.
- In the coming months we anticipate that the Feds along with other central banks will do exactly the same thing, sending inflation to much higher levels indeed.
- Gold is showing that it has support at the $1700/ level, suggesting the bottom for gold is behind us.
- Gold mining stocks in particular are undervalued and can be acquired at bargain prices.

Alfio Manciagli
Introduction
The US, UK and Europe now report ‘official’ inflationary figures at around 9% to 10%
In order to tame inflation, the central banks have implemented rate hikes and put a halt to QE. The US has aggressively raised rates, and they have commenced quantitative tightening (QT) a method of reducing the amount of cash in the system.
However, over in the UK the rate hikes have been smaller than those of the US and so the UK has a base rate of 2.25% compared with 3% to 3.25% in the US.
Political upheaval in the UK has seen the demise of the Prime Minister, Boris Johnson and the Finance Minister, Rishi Sunak. They have been replaced by Liz Truss as PM and Kwasi Kwarteng as Minister of Finance. They have tabled a “mini budget” which was big enough to rock the financial markets. The Pound fell dramatically, and so the BOE stepped in and bought UK treasuries in order to halt the decline.
This is a pivotal moment for the Bank of England as the cost of living rises and the populace become more and more disgruntled. The newly elected political leaders are trying to ease the pain that many of the Brits are now experiencing. However, creating more debt is not the answer to solving the problem largely created by the growth in government debt
According to Bloomberg:
"Kwasi Kwarteng signed off on £100 billion ($113 billion) of bond buying by the Bank of England"
Is this the first pivot away from QT and back to QE one wonders? I doubt whether the Federal Reserve will follow suit just yet, as their stated intention is to continue with their current monetary policy of raising interest rates. However, the feds are data-driven and can soon reverse their monetary policy. It wasn't so long ago that their stated aim what's to normalize interest rates. This aim wasn't achieved because they change their minds and reversed monetary policy.
In the coming months, we anticipate that the Feds along with other central banks will do exactly the same thing, sending inflation to much higher levels indeed
A reversal in policy could see the US dollar deteriorate as fast as it has appreciated.
Now, given the inverse relationship between the US dollar and the price of gold, we should see gold rise in dramatic fashion.
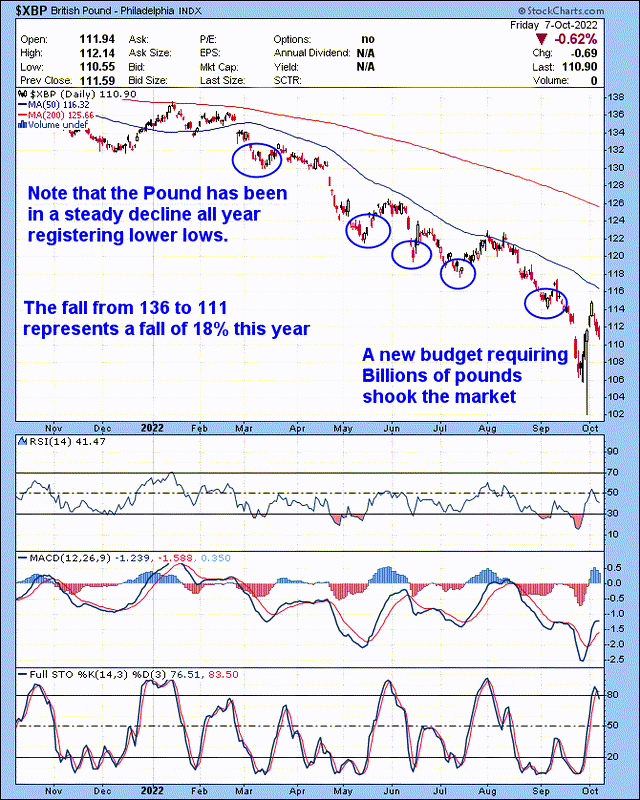
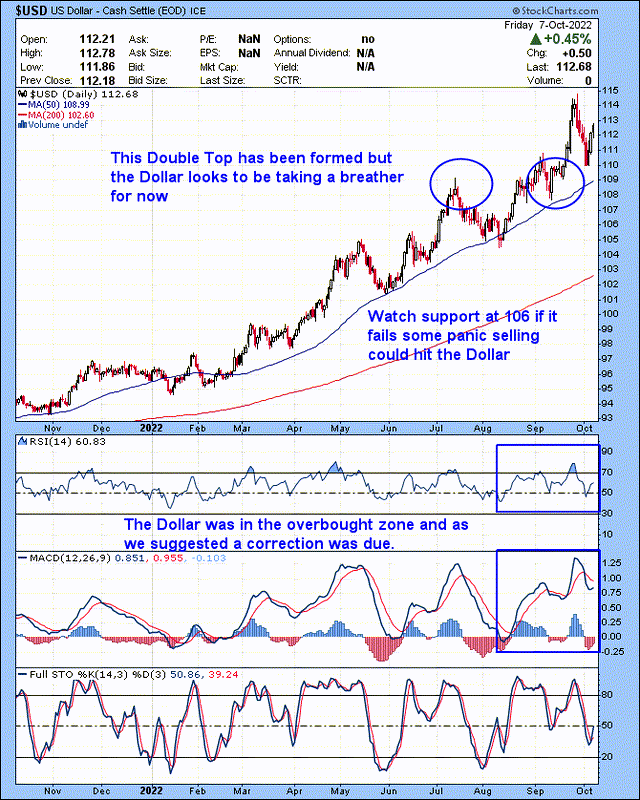
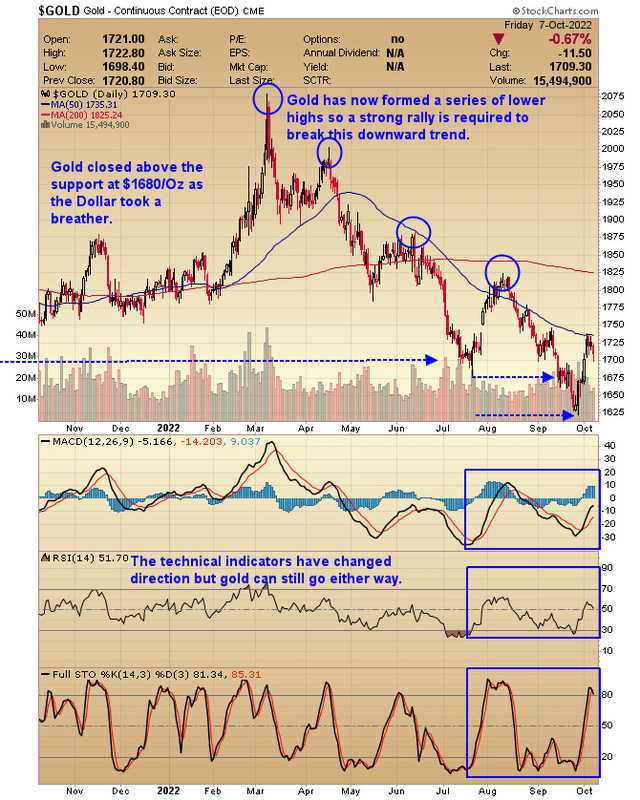
A quick look at the charts below depicts the demise of the Pound, the appreciation of the US Dollar and the volatile price of gold over the last 12 months.
One Year Chart of the British Pound
Note that the Pound has been in steady decline all year, registering lower lows. A new budget costing Billions of pounds shook the market. The BOE had to intervene in order to stop the pound from falling, which would in turn stoke the flames of inflation. The fall from 136 to 111 represents a fall of 18% this year.
British Pound One Year Chart (stockcharts)
One Year Chart of the US Dollar
The chart below depicts the rise of the US dollar from 96 to 112 year to date. This is due to US monetary policy of aggressively hiking rates and implementing a program of quantitative tightening.
US Dollar One Year Chart (Stockcharts)
One Year Chart of Gold
The chart below shows gold decline against the US dollar's appreciation in value. When the US dollar starts to weaken, the price of gold will increase considerably. Gold is showing that it has support at the $1700/ level, suggesting the bottom for gold is behind us.
Gold One Year Chart (stockcharts)
Conclusion
The Bank of England has been timid with its implementation of rate hikes
It is also entered the market to support the British pound through bond buying or quantitative easing
Over the next six months we could see other central bankers’ reverse direction on monetary policy including the Federal Reserve if this happens inflation will not have been tamed and will accelerate to much higher levels we have today
Further study is needed, but this could well be the bottom for gold and gold mining stocks
Gold mining stocks in particular are undervalued and can be acquired at bargain prices. However, I believe it is worth the time and effort to acquire some of the top-quality mining and royalty stocks at current price levels
It will still be a white-knuckle ride, but the Bank of England’s recent intervention could be viewed as a pivotal point in monetary policy when the historians look back on this period of economic history.
More By This Author:
Inflation On Steroids Could Double The Price Of Gold
The Gold Bugs Index the (HUI) Takes A Hit
Silver: Buy Now While Stocks Last
Disclosure:
For the record, I have been long physical gold and silver for a number of years and also own a portfolio of stocks in the precious metals sector including more


