
Since there is often a lot of noise found in the daily charts, I routinely view higher time frames for longer-term context and to get clues on where the market instruments may be headed in the near future.
Below I give a brief summary of my thought process when analyzing the same financial instrument on more than one time frame. I use the OMX Iceland All-Share Price Index (OMXIPI) as an example.
It is worth noting at the start that as of now I see no clear signs that a bottom is in for the OMXIPI. The first signal of improving conditions would be a higher swing low compared to the April low and then subsequently a higher swing high than the April high on the daily chart, preferably with strong momentum readings and crossing of the moving average lines.
Each new trading day provides important price data that either supports my current case or rejects it, which then means I need to re-evaluate my analysis. I always focus more on reading the price action rather than relying on indicators, as they are derivatives of price. How price reacts to certain levels is what matters most. Moving averages are usually lagging indicators, so I mostly use them as a confirming tool. My favorite leading or momentum indicator is what I call a moving average oscillator (MAO).
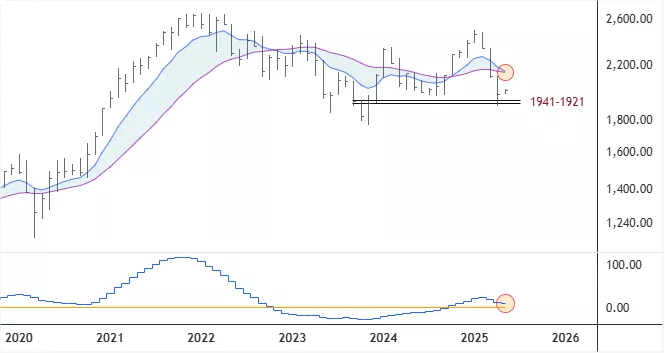
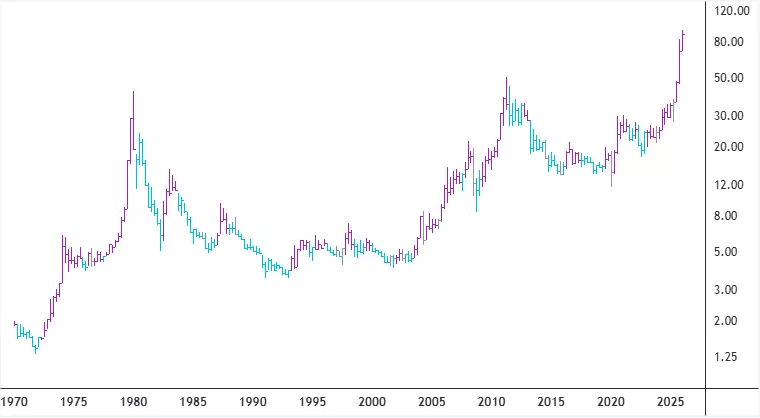
OMXIPI: Monthly Chart
Beginning with the monthly, I think the 1941-1921 area is important to watch. My very long-term Sentiment Swing Indicator (SSI) in the lower window has pulled back towards the zero line for the past two months; I prefer to see it continue to be there above and for the blue moving average line to stay above the purple moving average line.
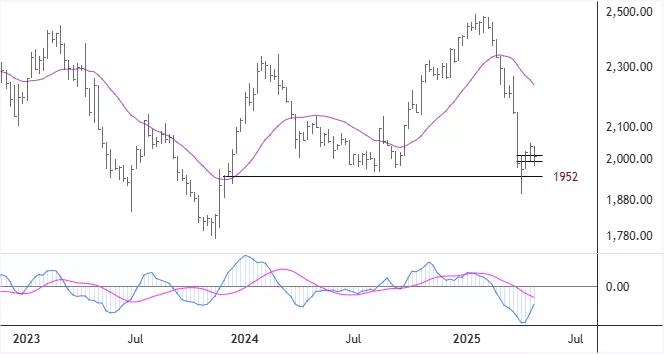
OMXIPI: Weekly Chart
The index has been balancing in the past three weeks or so, after finding at least temporary support from the August 2024 swing lows. My MAO in the lower window made a new momentum low on the last push down, suggesting more downside pressure might exist. However, the blue fast line (FL) of the oscillator is well extended and there is room for it to rise further - at least to cross the pink slow line (SL) – given the index manages to hold the 1971 level. I am also paying attention to the 1952 index level.
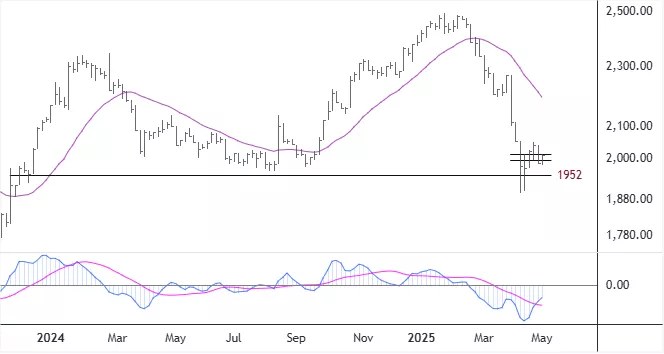
OMXIPI: Three-Day Chart
This timeframe illustrates better the momentum low on the MAO. If the index rises from the horizontal balance area, then the fast line (FL) can continue to rise towards the base or zero line (BL/ZL) – setting it up for a potential leg or swing down.
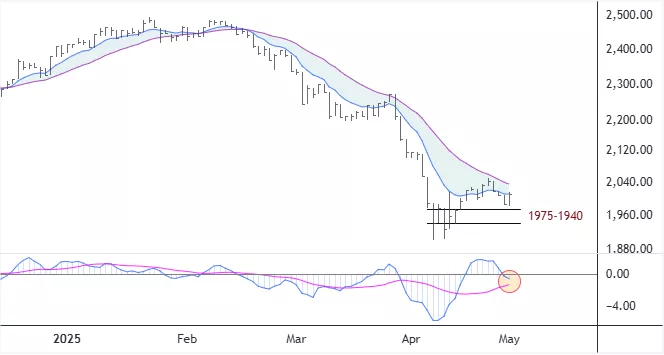
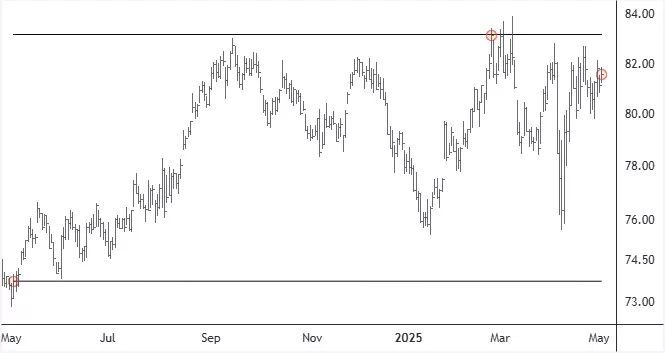
OMXIPI: Daily Chart
Here the index is currently on a downswing, following the upswing from April lows. Staying above the middle part of the 1975-1940 zone, or about 1958, sets it up for a rise above both moving average lines.
More By This Author:
Staples And Utilities Relatively Close To Their Highs
S&P 500 Index At Juncture Point
Silver To Gold Price Ratio Near All-Time Low

Comments
Log in or sign up to join the conversation.