

Image Source: Pexels
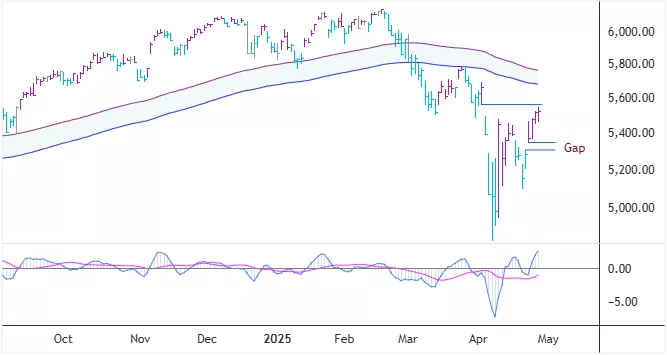
Starting with the daily chart of the S&P 500 index, yesterday´s action ended with a doji candle – which usually hints at indecision. The index has mostly filled the gap from the beginning of the month, with the upper range coming in at about 5571 (black horizontal line). My short-term momentum oscillator in the lower window suggests higher index levels within the next few days are probable, given the index manages to rise convincingly through 5571. If, however, the index pulls back from that level but stays above the gap from April 23-22, it still may set up a buying opportunity for stocks. But let´s not get carried away, we need to see first what today´s action brings. It is worth noting that my longer-term moving average channel has been sloping downwards for the past seven weeks or so and provided resistance on March 25th.
S&P 500 Index - Daily Chart
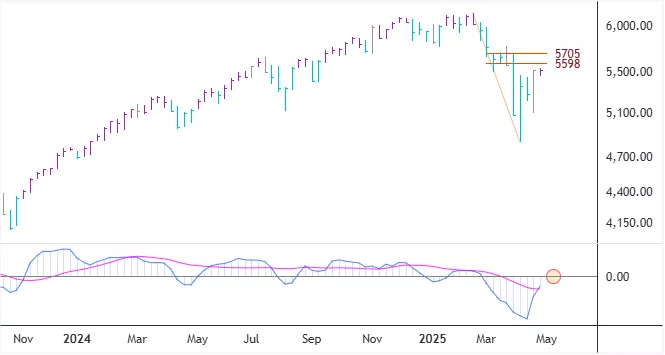
The HLC bars on my charts are painted based on price swings. Despite the latest drawdown seen in the S&P 500 index, by my rules so far it is only defined as a downswing in an uptrend on the weekly chart. This week began an upswing and I have marked the area 5598-5705 as important to watch. The zone roughly coincides with where the moving average channel is found. It seems there is some room for the momentum oscillator to rise further towards the zero line.
S&P 500 Index - Weekly Chart
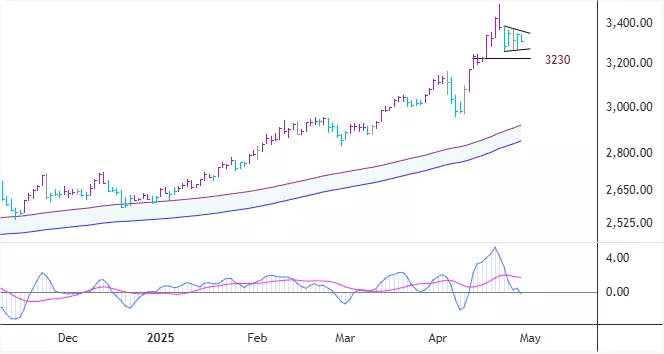
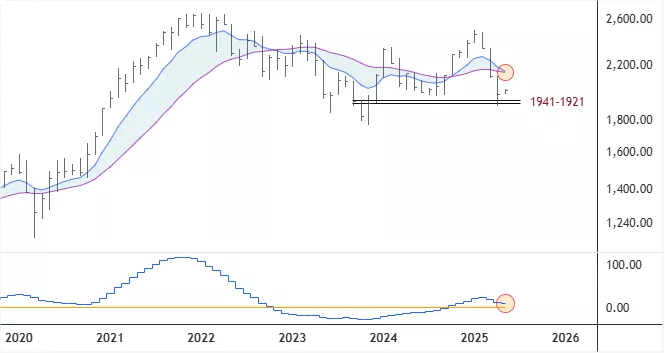
The spot price of gold recently hit the upper range of my first target area (3279-3336). It is well above the rising longer-term moving average channel and has been trading sideways for the last few days. I think the 3230 is a significant price level to monitor. If stock prices and risk assets continue to advance, then we might see gold´s price keep on correcting through time or decline towards the channel.
Gold´s Spot Price - Daily Chart
More By This Author:
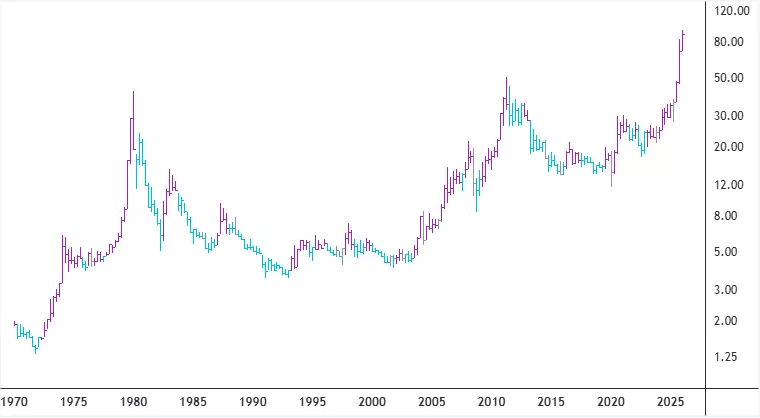
Silver To Gold Price Ratio Near All-Time Low
U.S. Equity Markets Have Probably Entered Their Capitulation Phase
Housing Related Stock Prices Seeking A Bottom
Comments
Log in or sign up to join the conversation.