

Image Source: Pixabay
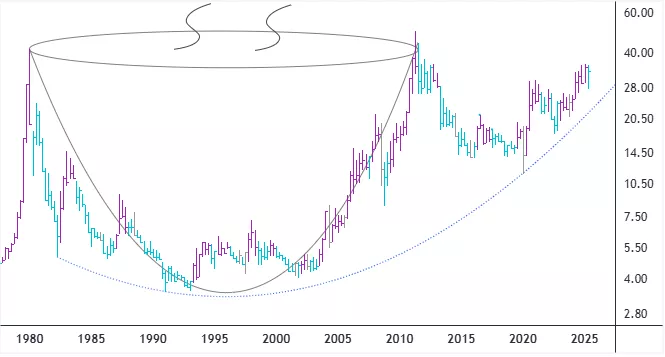
In nominal terms, the price of silver has formed a very large, multi-decade type of cup and handle pattern. I think it is the longest such formation in a duration that I have ever witnessed in my lifetime. It seems like the handle has been made and the price is setting itself up for a vertical launch or thrust to the upside.
At the moment, as with most other price chart formations, this is only a potential cup and handle pattern. In other words, now it is just a condition - not a signal yet. Price action must confirm it by rising convincingly through the $36 per ounce level and, preferably, stay there above going forward. Bear in mind that the prices of gold and silver can be very volatile.
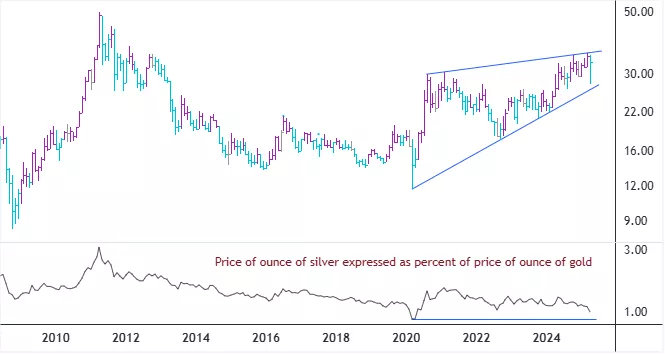
Currently, the price ratio between silver and gold stands at 1.0 – meaning the price of silver is only 1% of the price of gold. Historically, that is a very low percent value; in fact, the all-time ratio low was set at about 0.9 in early 2020. If silver´s price begins to accelerate to the upside, then I expect it to outperform gold´s price on a relative basis in the forthcoming months.
Price of Silver - Quarterly Chart
Price of Silver and Silver to Gold Ratio – Monthly Chart
More By This Author:
U.S. Equity Markets Have Probably Entered Their Capitulation Phase
Housing Related Stock Prices Seeking A Bottom
XAU Has Likely Broken Out To The Upside
Comments
Log in or sign up to join the conversation.