
Dr. Reddy's Laboratories Elliott Wave Forecast And Bullish Trend Insights
Dr. Reddy's Laboratories Elliott Wave Analysis – TradingLounge Daily Chart
Dr. Reddy's Laboratories Elliott Wave Technical Analysis
Function: Bullish Trend
Mode: Impulsive
Structure: Navy Blue Wave 1
Position: Gray Wave 3
Next Higher Degree Direction: Navy Blue Wave 1 (Started)
Wave Invalidation Level: 1089.49
Details:
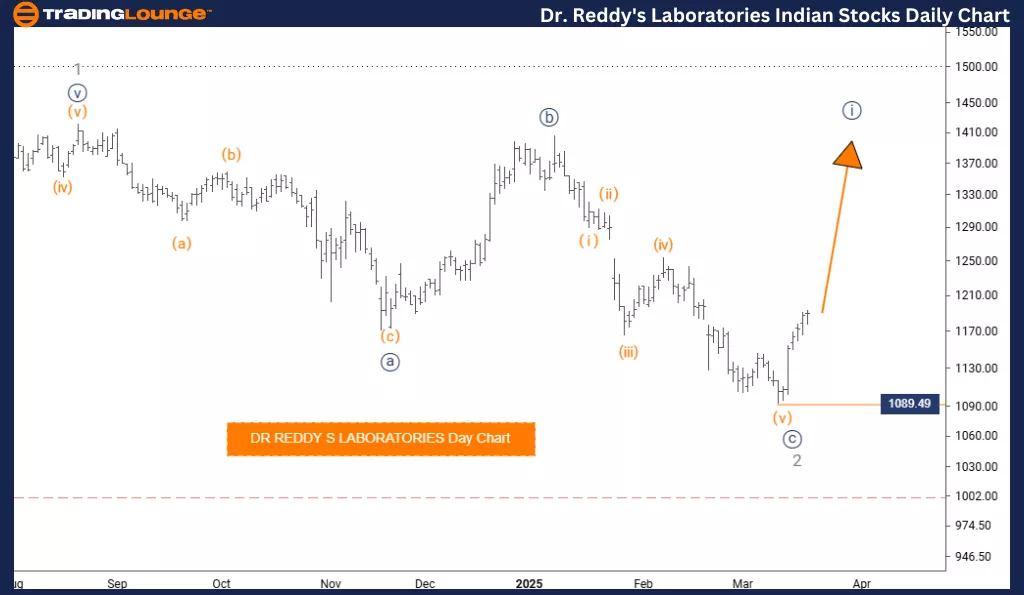
The daily Elliott Wave analysis for Dr. Reddy's Laboratories explores the stock’s current bullish trend. The price is moving in an impulsive phase, signaling upward momentum. The key structure in focus is Navy Blue Wave 1, positioned within Gray Wave 3 in the broader wave sequence.
The analysis indicates that Gray Wave 2 has likely completed, and Navy Blue Wave 1 of 3 is now active. This wave is anticipated to extend with strong upward movements before any major corrective phase begins.
The next significant wave to watch is Navy Blue Wave 1 on the higher degree scale, which has already begun. Traders should monitor the critical invalidation level at 1089.49. A break below this point would invalidate the current wave count and signal a shift in market dynamics.
Trading Outlook:
Traders should observe the development of Navy Blue Wave 1 and prepare for continued upside as the wave progresses. Understanding the wave structure and its place within the broader pattern is essential for planning entries and exits.
Focusing on the daily chart offers a tactical perspective for aligning strategies with near-term price action and potential reversals. Recognizing key wave transitions helps traders stay prepared and responsive to evolving market conditions.
Dr. Reddy's Laboratories Elliott Wave Analysis – TradingLounge Weekly Chart
Dr. Reddy's Laboratories Elliott Wave Technical Analysis
Function: Bullish Trend
Mode: Impulsive
Structure: Navy Blue Wave 1
Position: Gray Wave 3
Next Higher Degree Direction: Navy Blue Wave 1 (Started)
Wave Invalidation Level: 1089.49
Details:
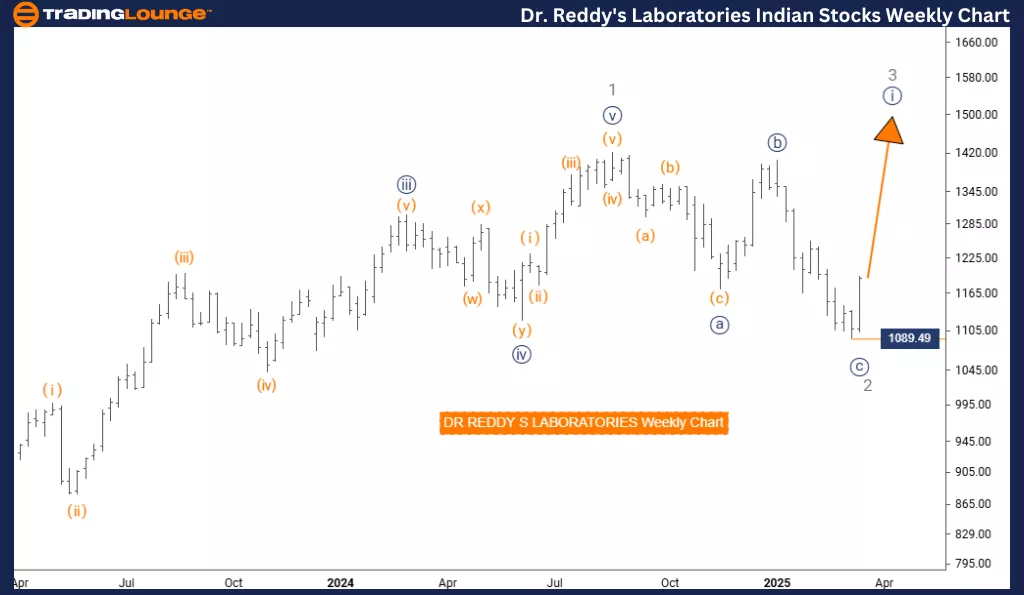
This weekly Elliott Wave analysis of Dr. Reddy's Laboratories provides a detailed outlook on the stock's medium- to long-term trend. The market is in a bullish phase, marked by impulsive wave activity. The core structure under analysis is Navy Blue Wave 1, which forms part of a broader sequence within Gray Wave 3.
According to the analysis, Gray Wave 2 appears to have completed. The market is now progressing into Navy Blue Wave 1 of 3, which is forecasted to follow an impulsive trajectory. The price movement is expected to remain strong as the wave continues to unfold.
The key invalidation level is 1089.49. If the price moves below this threshold, the current wave interpretation would be considered invalid, requiring a re-evaluation of the market setup.
Trading Outlook:
Investors and traders should monitor Navy Blue Wave 1 as it develops and prepare for sustained bullish movement. Recognizing where a wave begins and ends allows for more accurate forecasting and strategic trade planning.
By analyzing the weekly chart, this outlook delivers a broader view of the market's structural behavior. It enables market participants to align their trading decisions with longer-term trends and key inflection points. Identifying wave transitions and respecting invalidation zones is critical for effective risk management and trade positioning.
Technical Analyst: Malik Awais
More By This Author:
Elliott Wave Technical Forecast: News Corporation
Elliott Wave Technical Analysis: British Pound/U.S. Dollar - Friday, March 21
Elliott Wave Technical Analysis: Bovespa Index - Friday, March 21
At TradingLounge™, we provide actionable Elliott Wave analysis across over 200 markets. Access live chat rooms, advanced AI & algorithmic charting tools, and curated trade ...
more

