
Elliott Wave Technical Analysis: British Pound/U.S. Dollar - Friday, March 21
GBPUSD Elliott Wave Analysis – TradingLounge Day Chart
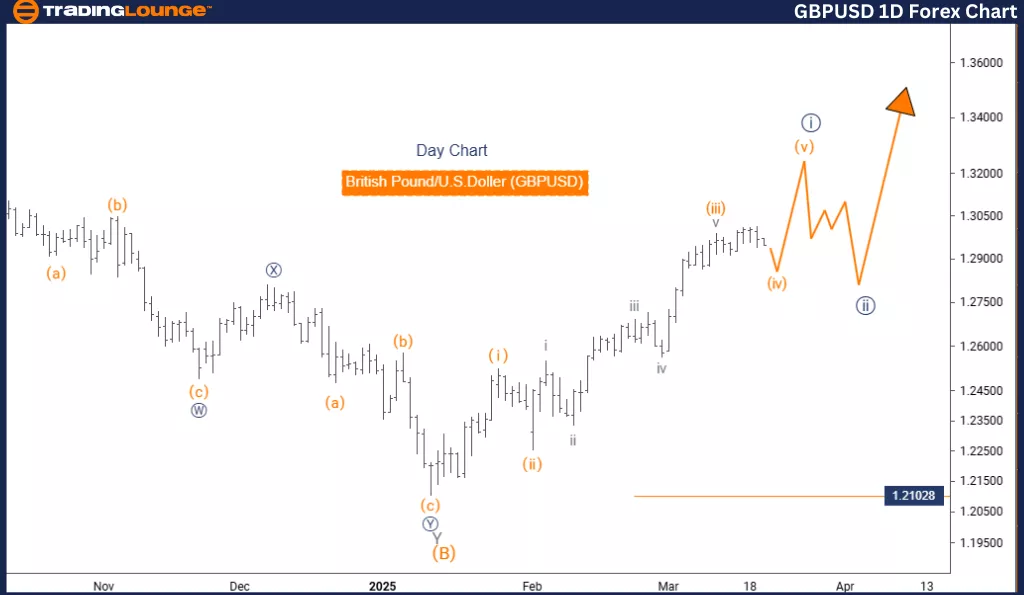
British Pound / U.S. Dollar (GBPUSD) – Day Chart
GBPUSD Elliott Wave Technical Analysis
Function: Bullish Trend
Mode: Impulsive
Structure: Navy Blue Wave 1
Position: Gray Wave 1
Next Lower Degree Direction: Navy Blue Wave 2
Wave Invalidation Level: 1.21028
Details:
The daily Elliott Wave analysis for GBPUSD explores the market's current bullish phase. This trend is driven by impulsive waves, indicating strong directional price action. At present, the structure under examination is Navy Blue Wave 1, which lies within Gray Wave 1, forming part of a broader wave sequence.
The market is actively progressing through Navy Blue Wave 1. This wave is expected to develop with momentum until a shift into Navy Blue Wave 2 occurs. A key technical level to monitor is 1.21028. If GBPUSD drops below this level, the existing wave count becomes invalid, signaling a possible change in the market's underlying structure.
Trading Outlook:
Traders are encouraged to track the progress of Navy Blue Wave 1 closely and remain alert for signs indicating the emergence of Navy Blue Wave 2. This phase shift could present new opportunities or necessitate adjustments in trading strategies.
This analysis emphasizes the value of identifying wave positions and invalidation levels to stay aligned with market direction. By studying the wave dynamics on the daily timeframe, traders can gain a broader understanding of long-term trends and potential reversal zones.
Wave pattern recognition and critical price level monitoring are essential tools in navigating market transitions effectively. With this framework, traders can enhance their decision-making and better prepare for future price developments.
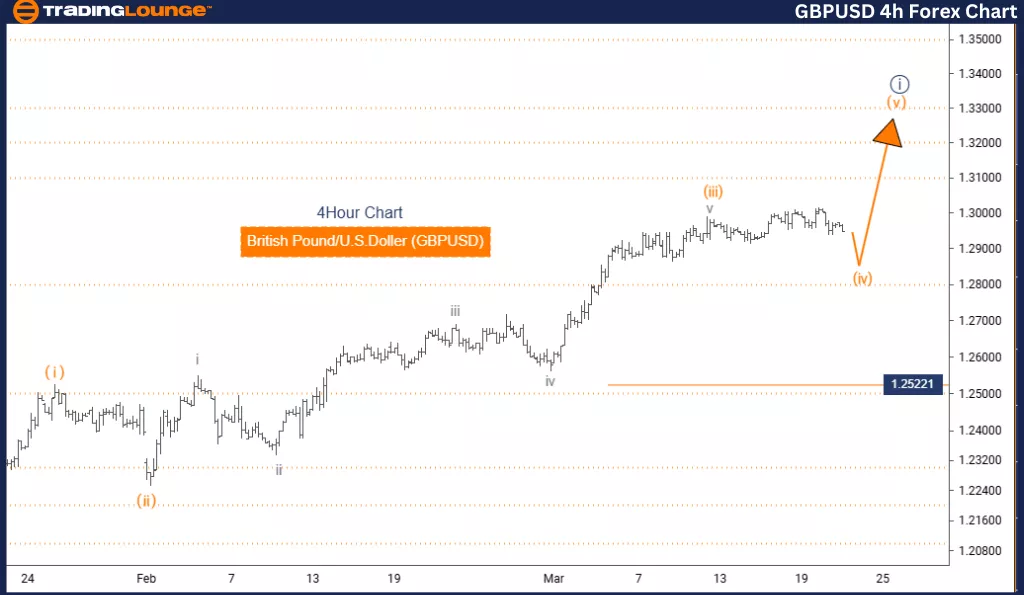
British Pound / U.S. Dollar (GBPUSD) – 4-Hour Chart
GBPUSD Elliott Wave Technical Analysis
Function: Counter Trend
Mode: Corrective
Structure: Orange Wave 4
Position: Navy Blue Wave 1
Next Lower Degree Direction: Orange Wave 5
Wave Invalidation Level: 1.25221
Details:
This 4-hour Elliott Wave analysis of GBPUSD focuses on the pair's short-term structure and movement. The current market behavior reflects a corrective phase rather than a strong directional trend. At this stage, Orange Wave 4 is developing within the broader context of Navy Blue Wave 1.
The analysis suggests that Orange Wave 3 has completed, and Orange Wave 4 of 3 is now unfolding. As a corrective wave, this movement is expected to be more sideways or involve retracements rather than a sharp directional push. Following the completion of Wave 4, attention should shift to Orange Wave 5, which will resume the broader impulsive trend.
The critical invalidation level for this current wave structure is 1.25221. If GBPUSD moves above this level, the wave count becomes invalid and would need a reassessment of the market structure.
Trading Outlook:
Traders should closely monitor the behavior of Orange Wave 4 for potential setups as the market prepares to transition into Orange Wave 5. Understanding the completion point of one wave and anticipating the next is crucial for timely and accurate trading decisions.
This short-term perspective offers actionable insights by examining the 4-hour chart, which allows traders to adjust strategies for more immediate trends and pivot points. Recognizing wave patterns and critical levels remains key to managing trades effectively during this corrective phase.
Technical Analyst: Malik Awais
More By This Author:
Elliott Wave Technical Analysis: Bitcoin Crypto Price News For Friday, March 21
Elliott Wave Technical Forecast: Newmont Corporation - Thursday, March 20
Elliott Wave Technical Analysis - Qualcomm Inc.
At TradingLounge™, we provide actionable Elliott Wave analysis across over 200 markets. Access live chat rooms, advanced AI & algorithmic charting tools, and curated trade ...
more

