
Elliott Wave Technical Analysis: Bitcoin Crypto Price News For Friday, March 21

Image Source: Pexels
Elliott Wave Analysis – TradingLounge Daily Chart
Bitcoin / U.S. Dollar (BTCUSD)
BTCUSD Elliott Wave Technical Overview
Function: Counter Trend
Mode: Corrective
Structure: Zigzag
Position: Wave b
Next Higher Degree Direction: Wave ((II))
Wave Cancellation Level: Not specified
Details:
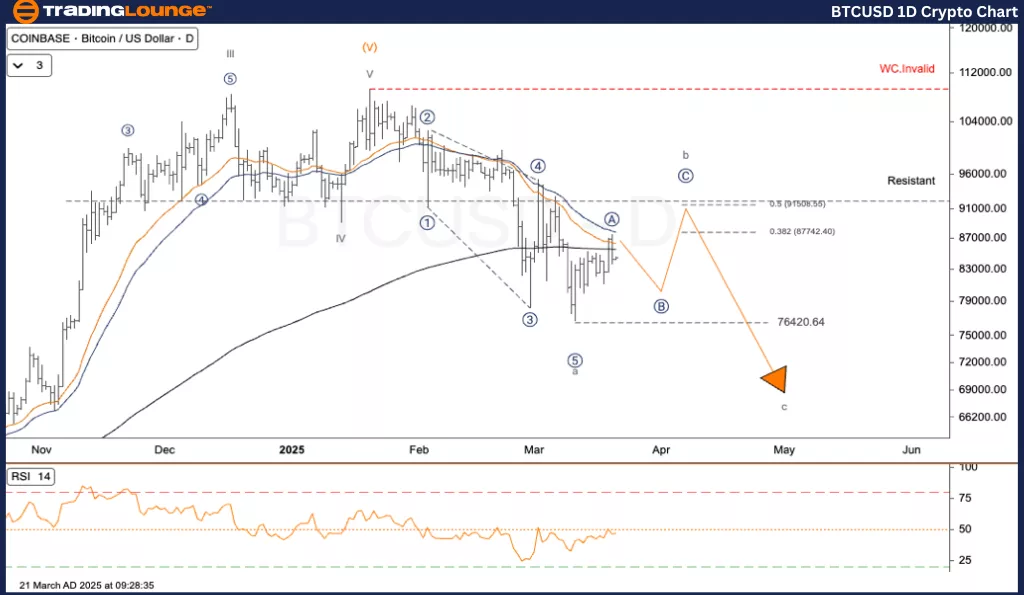
Bitcoin (BTC/USD) is in a corrective Elliott Wave pattern. Wave A recently concluded, and price action appears to be entering Wave B — a short-term bounce — before continuing into Wave C.
Bitcoin / U.S. Dollar (BTCUSD) Trading Strategy
BTCUSD is showing a modest recovery after completing a strong wave (a). The Elliott Wave framework indicates the market is now entering wave (b), which typically precedes another drop. Traders should monitor the key resistance at $90,792 — a potential inflection point. The downtrend wave structure concluded with wave ((5)) near $76,703. Currently, price action suggests that sub-wave a of (b) is complete and wave b of (b) is underway.
Key Resistance: $90,792
If BTCUSD cannot surpass this level, expect a strong downward move in wave c of (b), potentially followed by wave (c).
Trading Strategies
Strategy
✅ For Short-Term Traders (Swing Trade)
If price tests the $90,792 resistance and faces selling pressure, it may be a good opportunity to enter short positions in alignment with wave (c) direction.
Risk Management:
If BTCUSD breaks above $111,954, the current downtrend scenario becomes invalid and requires reassessment.
Elliott Wave Analysis – TradingLounge H4 Chart
Bitcoin / U.S. Dollar (BTCUSD)
BTCUSD Elliott Wave Technical Overview
Function: Counter Trend
Mode: Corrective
Structure: Zigzag
Position: Wave b
Next Higher Degree Direction: Wave ((II))
Wave Cancellation Level: Not specified
Details:
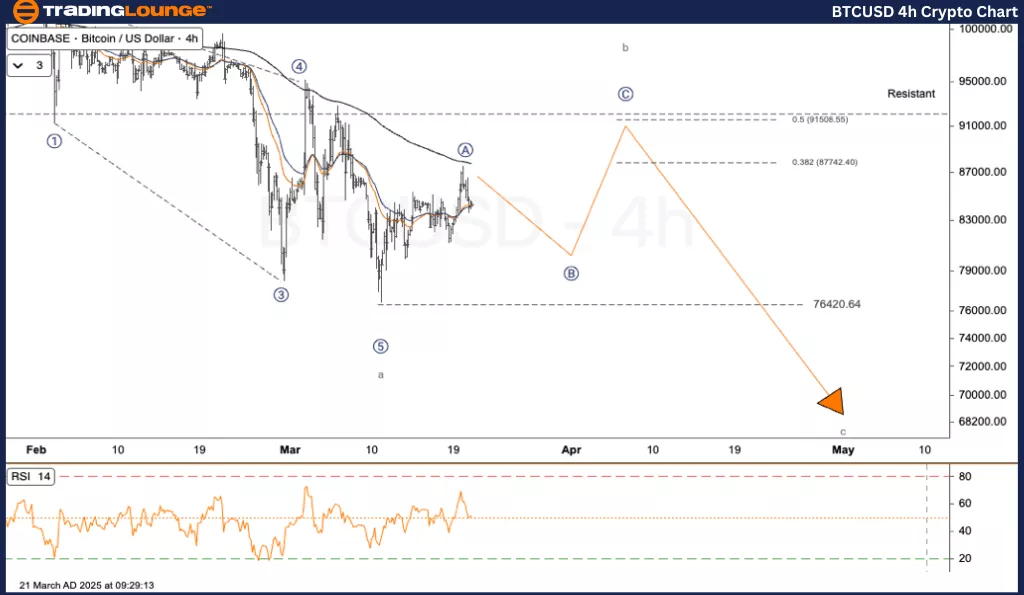
BTC/USD continues within a corrective Elliott Wave structure. After completing Wave A, the asset seems to be starting Wave B — a temporary rebound — ahead of a potential move into Wave C.
Bitcoin / U.S. Dollar (BTCUSD) Trading Strategy
The market is recovering slightly from wave (a), and the Elliott Wave model suggests wave (b) is now unfolding. Watch the $90,792 resistance level closely, as it may dictate the next move. Wave ((5)) of the downtrend ended near $76,703. BTC is likely in wave b of (b), following the completion of sub-wave a.
Key Resistance: $90,792
Failure to break this level could trigger a drop in wave c of (b), followed by wave (c).
Trading Strategies
Strategy
✅ For Short-Term Traders (Swing Trade)
A test of $90,792 followed by bearish signals may present a shorting opportunity in line with wave (c) expectations.
Risk Management:
A breakout above $111,954 invalidates the bearish wave structure and needs a new analysis.
TradingLounge Analyst: Kittiampon Somboonsod, CEWA
More By This Author:
Elliott Wave Technical Forecast: Newmont Corporation - Thursday, March 20
Elliott Wave Technical Analysis - Qualcomm Inc.
Elliott Wave Technical Analysis: Euro/U.S. Dollar - Thursday, March 20
At TradingLounge™, we provide actionable Elliott Wave analysis across over 200 markets. Access live chat rooms, advanced AI & algorithmic charting tools, and curated trade ...
more

