
Bovespa Index Elliott Wave Analysis – TradingLounge Daily Chart
Bovespa Index Elliott Wave Technical Analysis
Function: Bullish Trend
Mode: Impulsive
Structure: Orange Wave 1
Position: Navy Blue Wave 3
Next Lower Degree Direction: Orange Wave 2
Wave Invalidation Level: 122,314.53
Details:
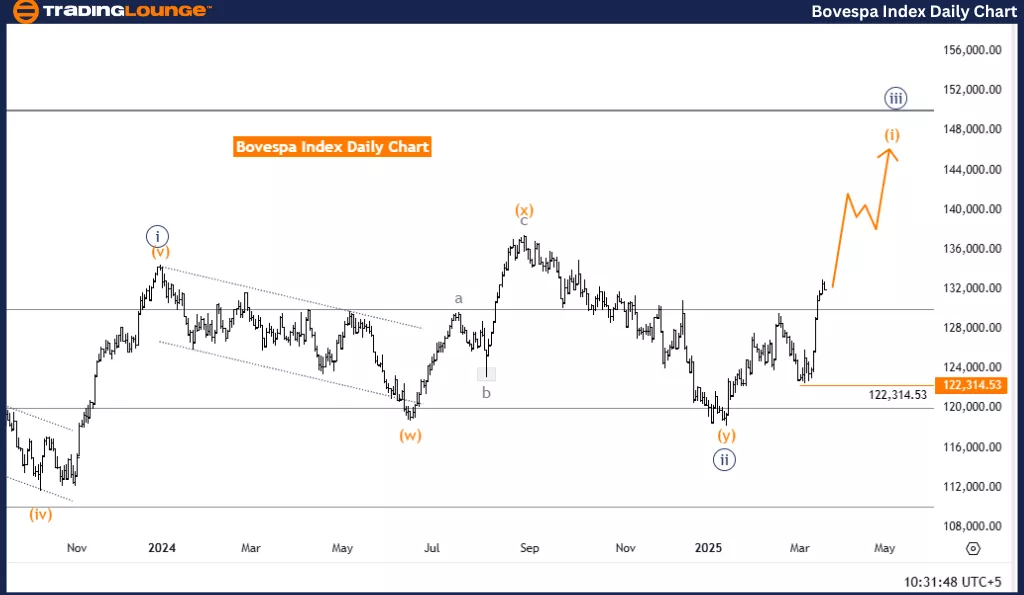
This daily Elliott Wave analysis of the Bovespa Index outlines the current market condition and potential future movement. The market is presently in a bullish trend, led by impulsive, rather than corrective, wave formations. The key structure being tracked is Orange Wave 1, situated within Navy Blue Wave 3, which places it within a broader upward movement.
The analysis indicates that Navy Blue Wave 2 has likely concluded, and Orange Wave 1 of 3 is now unfolding. As an impulsive wave, it suggests strong upward momentum before the formation of the next key wave.
Following the completion of Orange Wave 1, Orange Wave 2 is expected to emerge. A crucial price level to monitor is 122,314.53. If the Bovespa Index drops below this invalidation point, the current wave count would be considered invalid, requiring a reassessment of market conditions.
Trading Outlook:
Traders should keep a close eye on the development of Orange Wave 1 and anticipate the possible beginning of Orange Wave 2. Identifying these wave transitions is essential for planning entries and exits in alignment with broader market trends.
By focusing on the daily chart, this analysis offers a clearer view of short- to mid-term trends, enabling traders to refine strategies based on current wave dynamics. Understanding wave progression and recognizing key invalidation points is critical for adapting to ongoing market shifts.
Bovespa Index Elliott Wave Analysis – TradingLounge Weekly Chart
Bovespa Index Elliott Wave Technical Analysis
Function: Bullish Trend
Mode: Impulsive
Structure: Navy Blue Wave 3
Position: Gray Wave 3
Next Lower Degree Direction: Navy Blue Wave 4 (Started)
Wave Invalidation Level: 122,314.53
Details:
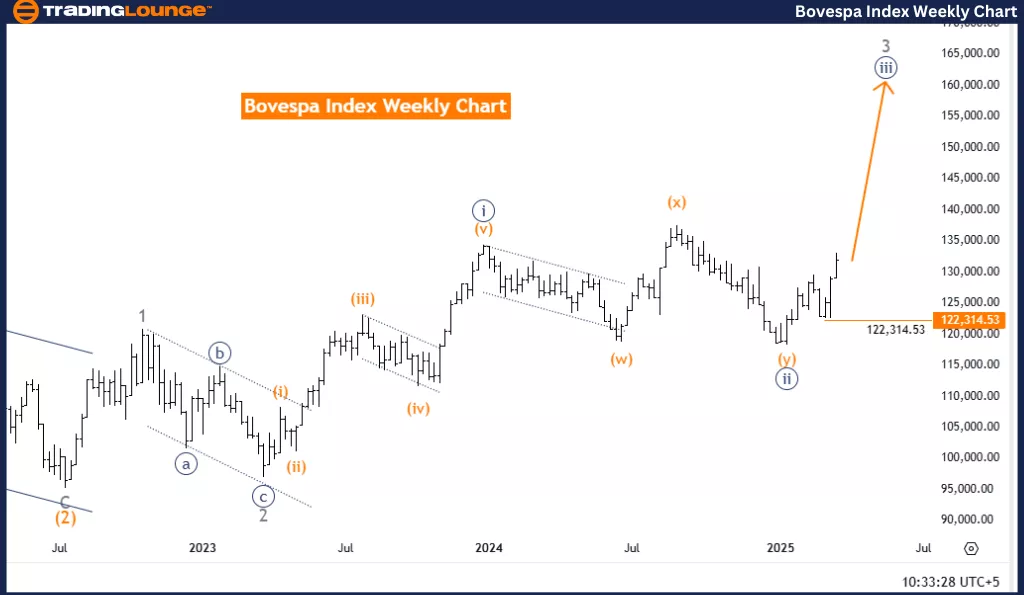
This weekly Elliott Wave analysis of the Bovespa Index presents a comprehensive view of the market's longer-term direction. Currently, the index is in a bullish phase, marked by impulsive movements. The focus is on Navy Blue Wave 3, which is embedded within Gray Wave 3 as part of a larger wave sequence.
According to the analysis, Navy Blue Wave 2 has likely concluded, making way for Navy Blue Wave 3, which is now in motion. This wave is expected to be strong and directional before a correction develops into Navy Blue Wave 4, which has already begun forming.
The critical invalidation level is 122,314.53. If the Bovespa Index falls below this level, the current Elliott Wave structure will be considered invalid, potentially indicating a shift in market behavior.
Trading Outlook:
Market participants should monitor the development of Navy Blue Wave 3 and prepare for the possible continuation of Navy Blue Wave 4. Understanding where the current wave lies in the overall sequence is key to making informed decisions.
By using the weekly chart, this analysis provides a long-term perspective, helping traders align strategies with broader market cycles and potential pivot points. Recognizing the structure of wave patterns and respecting invalidation levels improves confidence and accuracy in forecasting.
Technical Analyst: Malik Awais
More By This Author:
Elliott Wave Technical Analysis: British Pound/U.S. Dollar - Friday, March 21
Elliott Wave Technical Analysis: Bitcoin Crypto Price News For Friday, March 21
Elliott Wave Technical Forecast: Newmont Corporation - Thursday, March 20


Comments
Log in or sign up to join the conversation.