
Here are the latest charts and statistics for the Commitment of Traders (COT) data published by the Commodities Futures Trading Commission (CFTC).
The latest COT data is updated through Tuesday April 18th and shows a quick view of how large traders (for-profit speculators and commercial entities) were positioned in the futures markets.
Weekly Speculator Changes led by Steel & Silver
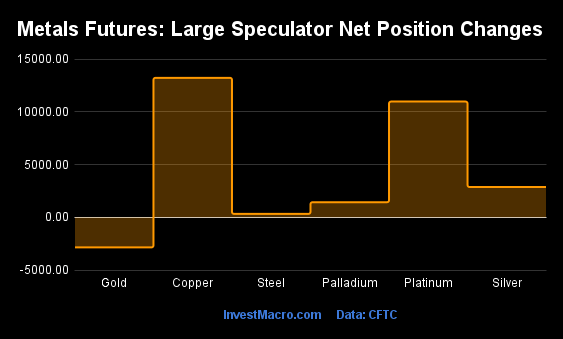
The COT metals markets speculator bets were higher this week as five out of the six metals markets we cover had higher positioning while the other one market had lower speculator contracts.
Leading the gains for the metals was Copper (13,237 contracts) with Platinum (10,986 contracts), Silver (2,877 contracts), Palladium (1,436 contracts) and Steel (329 contracts) also having positive weeks.
The market with a decline in speculator bets for the week was Gold with a drop of -2,852 contracts on the week.
Copper bets go bullish for first time since February
Highlighting the COT metals data this week is the renewed bullishness for the Copper speculative positions. The large speculator position in Copper futures rose by over +13,000 contracts this week and are higher for the third time in the past five weeks.
Copper speculative bets have now gained by a total of +23,090 contracts over the past five weeks, going from a bearish net position of -14,156 contracts on March 14th to this week’s net position of +8,934 contracts. This week was the first time that net positions crossed over into bullish territory since February and Copper’s sentiment has been helped out by China’s economic reopening which uses the metal for many types of manufacturing and industry.
The Copper front-month futures price dipped this week but has been higher in the three of the past five weeks, continuing an uptrend since bottoming in July of 2022. Copper futures have gained by approximately 25 percent since that recent bottom in July and closed this week just below the $4.00 per pound major price level.
|
Apr-18-2023
|
OI
|
OI-Index
|
Spec-Net
|
Spec-Index
|
Com-Net
|
COM-Index
|
Smalls-Net
|
Smalls-Index
|
|---|---|---|---|---|---|---|---|---|
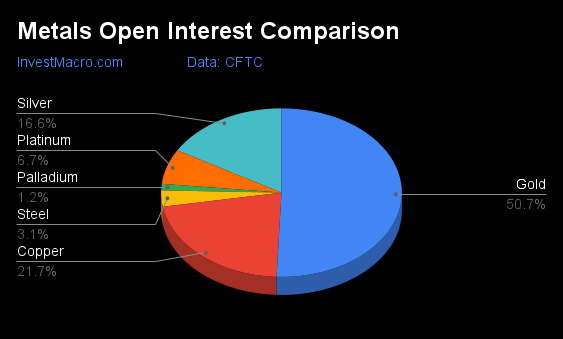
| Gold | 482,254 | 28 | 189,893 | 61 | -216,425 | 40 | 26,532 | 46 |
| Copper | 206,216 | 47 | 8,934 | 36 | -16,280 | 60 | 7,346 | 65 |
| Silver | 158,371 | 46 | 26,595 | 56 | -38,656 | 47 | 12,061 | 33 |
| Platinum | 63,794 | 53 | 24,319 | 72 | -28,202 | 35 | 3,883 | 20 |
| Palladium | 11,848 | 82 | -5,637 | 13 | 6,151 | 89 | -514 | 11 |
Strength Scores led by Platinum & Gold
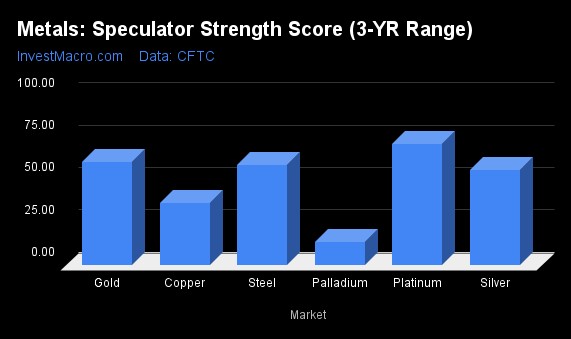
COT Strength Scores (a normalized measure of Speculator positions over a 3-Year range, from 0 to 100 where above 80 is Extreme-Bullish and below 20 is Extreme-Bearish) showed that Platinum (72 percent) and Gold (61 percent) lead the metals markets this week. Steel (59 percent) comes in as the next highest in the weekly strength scores.
On the downside, Palladium (13 percent) comes in at the lowest strength level currently and is in Extreme-Bearish territory (below 20 percent).
Strength Statistics:
Gold (60.6 percent) vs Gold previous week (61.9 percent)
Silver (56.2 percent) vs Silver previous week (52.1 percent)
Copper (36.4 percent) vs Copper previous week (24.6 percent)
Platinum (71.7 percent) vs Platinum previous week (46.4 percent)
Palladium (13.5 percent) vs Palladium previous week (0.2 percent)
Steel (59.3 percent) vs Palladium previous week (58.4 percent)
Silver & Platinum top the 6-Week Strength Trends
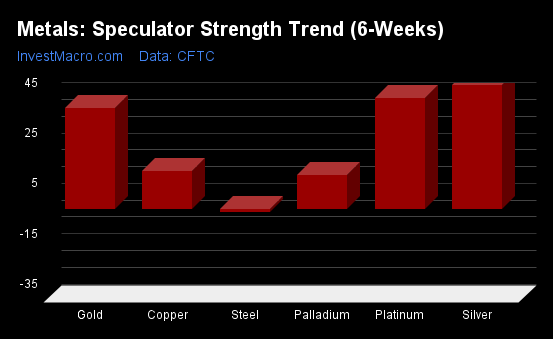
COT Strength Score Trends (or move index, calculates the 6-week changes in strength scores) showed that Silver (49 percent) and Platinum (44 percent) lead the past six weeks trends for metals. Gold (40 percent) is the next highest positive mover in the latest trends data.
Steel (-1 percent) leads the downside trend scores currently.
Move Statistics:
Gold (40.2 percent) vs Gold previous week (37.0 percent)
Silver (49.1 percent) vs Silver previous week (33.9 percent)
Copper (14.9 percent) vs Copper previous week (1.6 percent)
Platinum (44.3 percent) vs Platinum previous week (18.5 percent)
Palladium (13.5 percent) vs Palladium previous week (-9.7 percent)
Steel (-1.2 percent) vs Steel previous week (-4.1 percent)
Individual Markets:
Gold Comex Futures:
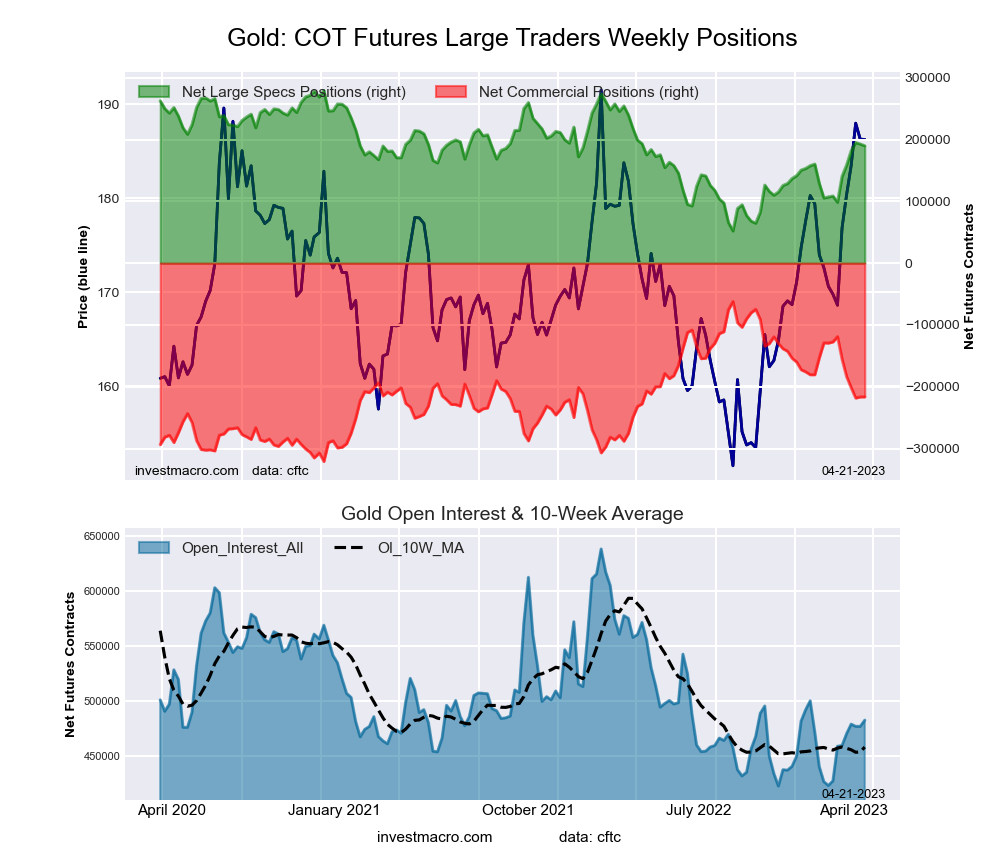
The Gold Comex Futures large speculator standing this week was a net position of 189,893 contracts in the data reported through Tuesday. This was a weekly decline of -2,852 contracts from the previous week which had a total of 192,745 net contracts.
This week’s current strength score (the trader positioning range over the past three years, measured from 0 to 100) shows the speculators are currently Bullish with a score of 60.6 percent. The commercials are Bearish with a score of 40.4 percent and the small traders (not shown in chart) are Bearish with a score of 46.5 percent.
| Gold Futures Statistics | SPECULATORS | COMMERCIALS | SMALL TRADERS |
| – Percent of Open Interest Longs: | 53.9 | 25.6 | 10.5 |
| – Percent of Open Interest Shorts: | 14.6 | 70.5 | 5.0 |
| – Net Position: | 189,893 | -216,425 | 26,532 |
| – Gross Longs: | 260,061 | 123,496 | 50,647 |
| – Gross Shorts: | 70,168 | 339,921 | 24,115 |
| – Long to Short Ratio: | 3.7 to 1 | 0.4 to 1 | 2.1 to 1 |
| NET POSITION TREND: | |||
| – Strength Index Score (3 Year Range Pct): | 60.6 | 40.4 | 46.5 |
| – Strength Index Reading (3 Year Range): | Bullish | Bearish | Bearish |
| NET POSITION MOVEMENT INDEX: | |||
| – 6-Week Change in Strength Index: | 40.2 | -37.7 | 15.3 |
Silver Comex Futures:
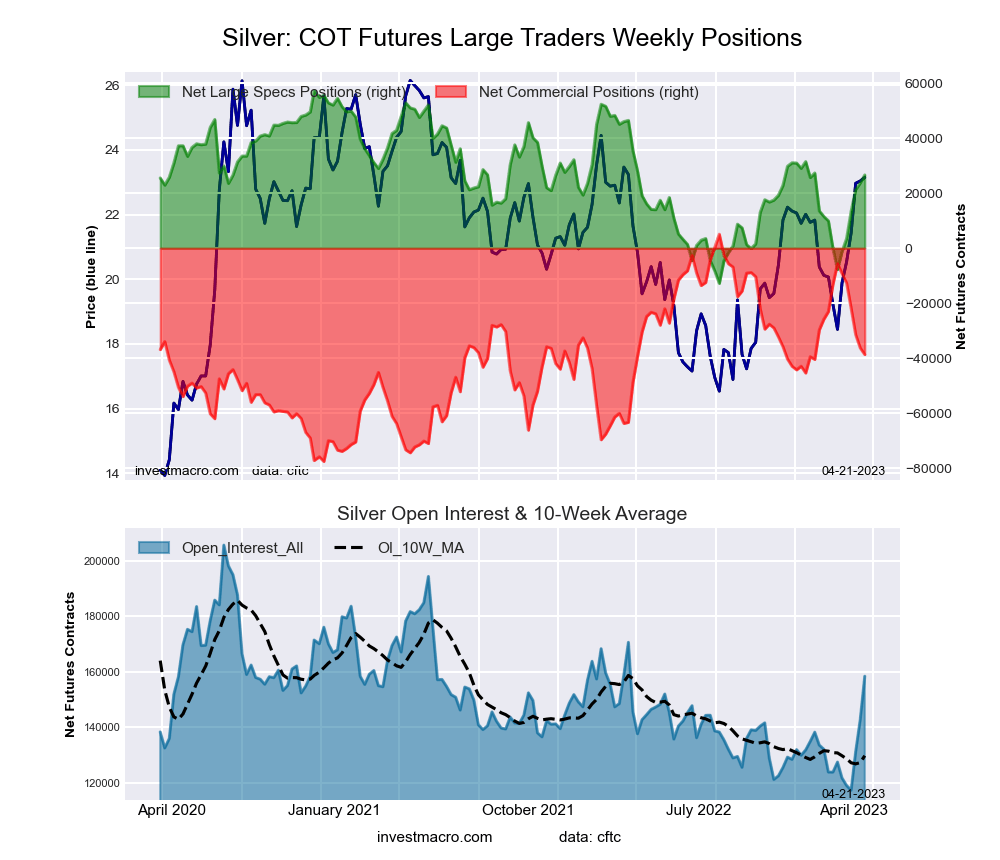
The Silver Comex Futures large speculator standing this week was a net position of 26,595 contracts in the data reported through Tuesday. This was a weekly lift of 2,877 contracts from the previous week which had a total of 23,718 net contracts.
This week’s current strength score (the trader positioning range over the past three years, measured from 0 to 100) shows the speculators are currently Bullish with a score of 56.2 percent. The commercials are Bearish with a score of 47.1 percent and the small traders (not shown in chart) are Bearish with a score of 33.4 percent.
| Silver Futures Statistics | SPECULATORS | COMMERCIALS | SMALL TRADERS |
| – Percent of Open Interest Longs: | 39.8 | 32.8 | 16.1 |
| – Percent of Open Interest Shorts: | 23.0 | 57.2 | 8.4 |
| – Net Position: | 26,595 | -38,656 | 12,061 |
| – Gross Longs: | 62,968 | 51,891 | 25,438 |
| – Gross Shorts: | 36,373 | 90,547 | 13,377 |
| – Long to Short Ratio: | 1.7 to 1 | 0.6 to 1 | 1.9 to 1 |
| NET POSITION TREND: | |||
| – Strength Index Score (3 Year Range Pct): | 56.2 | 47.1 | 33.4 |
| – Strength Index Reading (3 Year Range): | Bullish | Bearish | Bearish |
| NET POSITION MOVEMENT INDEX: | |||
| – 6-Week Change in Strength Index: | 49.1 | -40.0 | -7.5 |
Copper Grade #1 Futures:
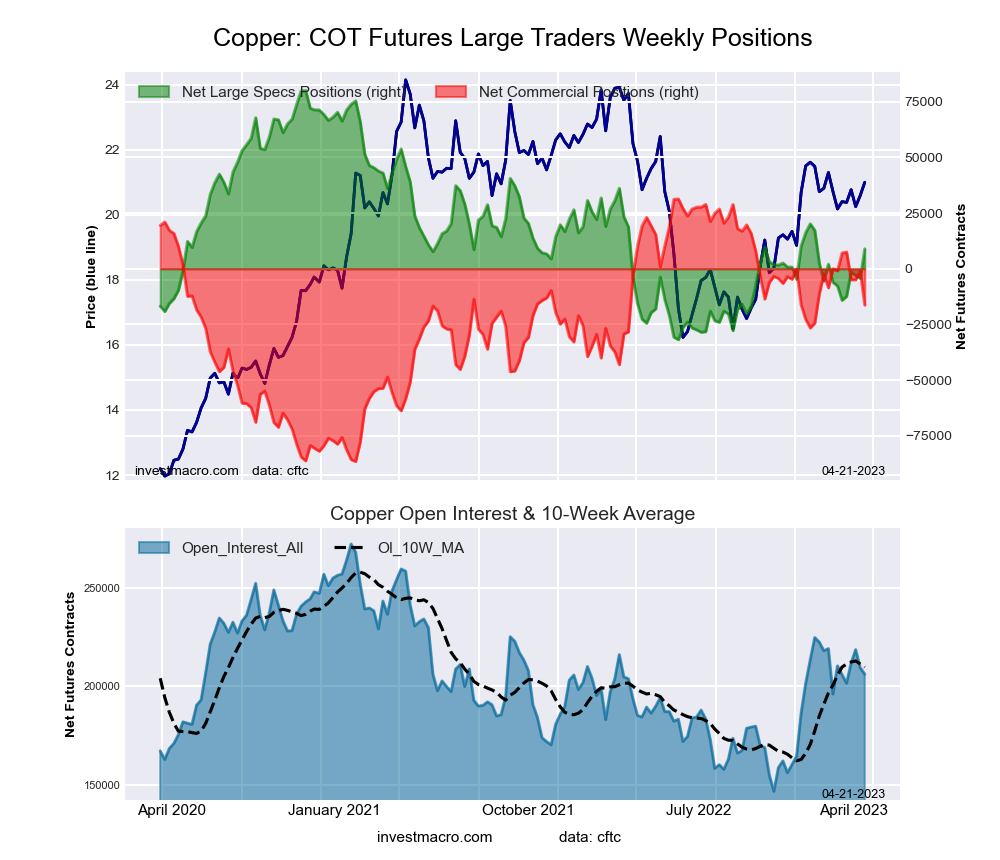
The Copper Grade #1 Futures large speculator standing this week was a net position of 8,934 contracts in the data reported through Tuesday. This was a weekly lift of 13,237 contracts from the previous week which had a total of -4,303 net contracts.
This week’s current strength score (the trader positioning range over the past three years, measured from 0 to 100) shows the speculators are currently Bearish with a score of 36.4 percent. The commercials are Bullish with a score of 59.6 percent and the small traders (not shown in chart) are Bullish with a score of 64.8 percent.
| Copper Futures Statistics | SPECULATORS | COMMERCIALS | SMALL TRADERS |
| – Percent of Open Interest Longs: | 32.6 | 43.2 | 9.1 |
| – Percent of Open Interest Shorts: | 28.3 | 51.1 | 5.6 |
| – Net Position: | 8,934 | -16,280 | 7,346 |
| – Gross Longs: | 67,262 | 89,131 | 18,851 |
| – Gross Shorts: | 58,328 | 105,411 | 11,505 |
| – Long to Short Ratio: | 1.2 to 1 | 0.8 to 1 | 1.6 to 1 |
| NET POSITION TREND: | |||
| – Strength Index Score (3 Year Range Pct): | 36.4 | 59.6 | 64.8 |
| – Strength Index Reading (3 Year Range): | Bearish | Bullish | Bullish |
| NET POSITION MOVEMENT INDEX: | |||
| – 6-Week Change in Strength Index: | 14.9 | -13.0 | -8.1 |
Platinum Futures:
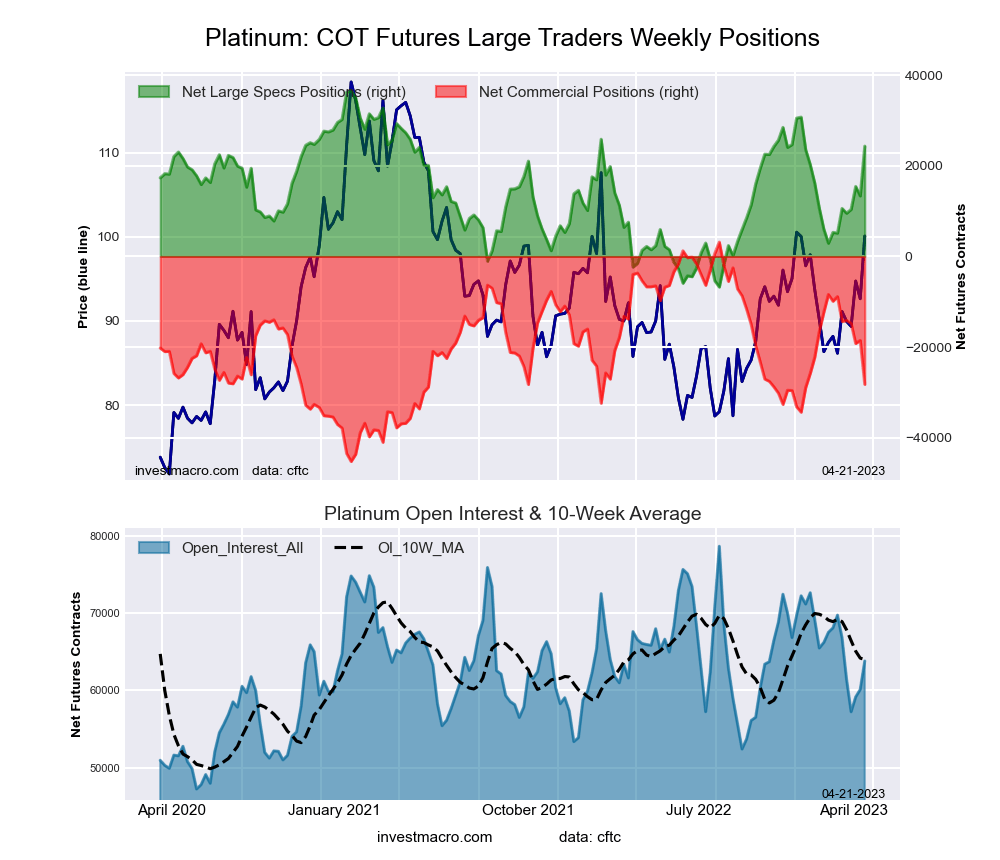
The Platinum Futures large speculator standing this week was a net position of 24,319 contracts in the data reported through Tuesday. This was a weekly boost of 10,986 contracts from the previous week which had a total of 13,333 net contracts.
This week’s current strength score (the trader positioning range over the past three years, measured from 0 to 100) shows the speculators are currently Bullish with a score of 71.7 percent. The commercials are Bearish with a score of 35.2 percent and the small traders (not shown in chart) are Bearish with a score of 20.2 percent.
| Platinum Futures Statistics | SPECULATORS | COMMERCIALS | SMALL TRADERS |
| – Percent of Open Interest Longs: | 54.9 | 28.4 | 11.1 |
| – Percent of Open Interest Shorts: | 16.8 | 72.7 | 5.0 |
| – Net Position: | 24,319 | -28,202 | 3,883 |
| – Gross Longs: | 35,028 | 18,147 | 7,076 |
| – Gross Shorts: | 10,709 | 46,349 | 3,193 |
| – Long to Short Ratio: | 3.3 to 1 | 0.4 to 1 | 2.2 to 1 |
| NET POSITION TREND: | |||
| – Strength Index Score (3 Year Range Pct): | 71.7 | 35.2 | 20.2 |
| – Strength Index Reading (3 Year Range): | Bullish | Bearish | Bearish |
| NET POSITION MOVEMENT INDEX: | |||
| – 6-Week Change in Strength Index: | 44.3 | -40.0 | 2.3 |
Palladium Futures:
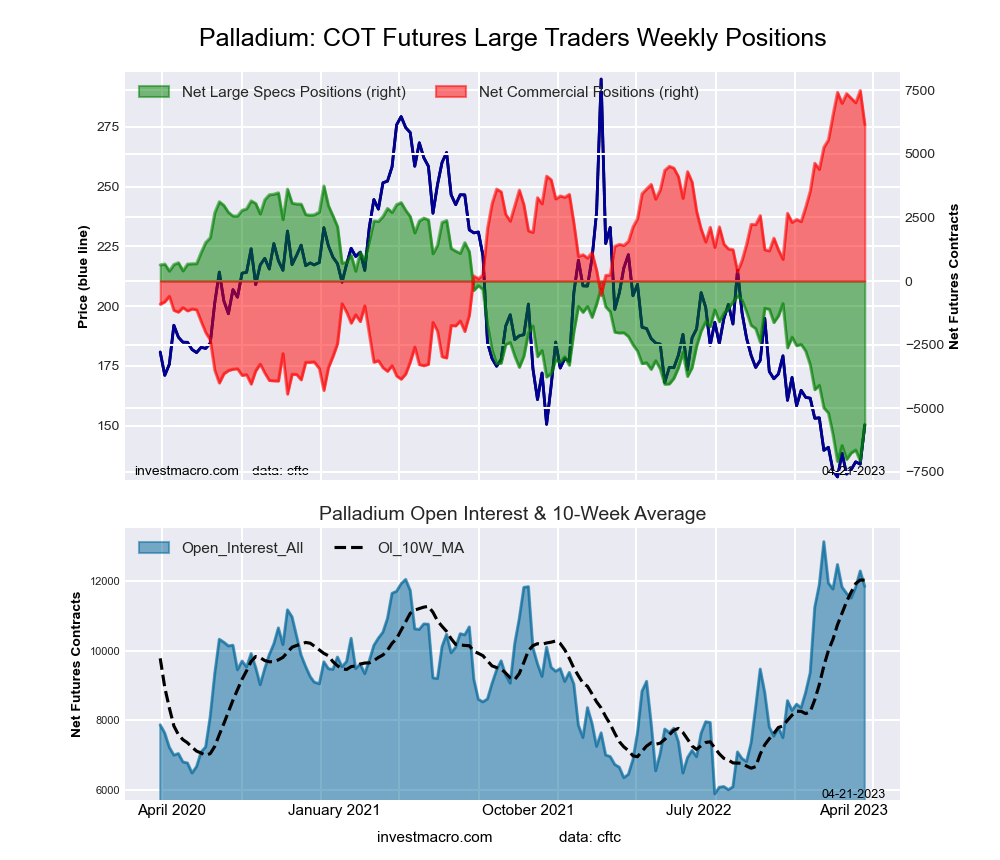
The Palladium Futures large speculator standing this week was a net position of -5,637 contracts in the data reported through Tuesday. This was a weekly rise of 1,436 contracts from the previous week which had a total of -7,073 net contracts.
This week’s current strength score (the trader positioning range over the past three years, measured from 0 to 100) shows the speculators are currently Bearish-Extreme with a score of 13.5 percent. The commercials are Bullish-Extreme with a score of 88.8 percent and the small traders (not shown in chart) are Bearish-Extreme with a score of 10.8 percent.
| Palladium Futures Statistics | SPECULATORS | COMMERCIALS | SMALL TRADERS |
| – Percent of Open Interest Longs: | 16.1 | 67.4 | 9.1 |
| – Percent of Open Interest Shorts: | 63.7 | 15.5 | 13.5 |
| – Net Position: | -5,637 | 6,151 | -514 |
| – Gross Longs: | 1,912 | 7,988 | 1,084 |
| – Gross Shorts: | 7,549 | 1,837 | 1,598 |
| – Long to Short Ratio: | 0.3 to 1 | 4.3 to 1 | 0.7 to 1 |
| NET POSITION TREND: | |||
| – Strength Index Score (3 Year Range Pct): | 13.5 | 88.8 | 10.8 |
| – Strength Index Reading (3 Year Range): | Bearish-Extreme | Bullish-Extreme | Bearish-Extreme |
| NET POSITION MOVEMENT INDEX: | |||
| – 6-Week Change in Strength Index: | 13.5 | -10.6 | -11.5 |
Steel Futures Futures:
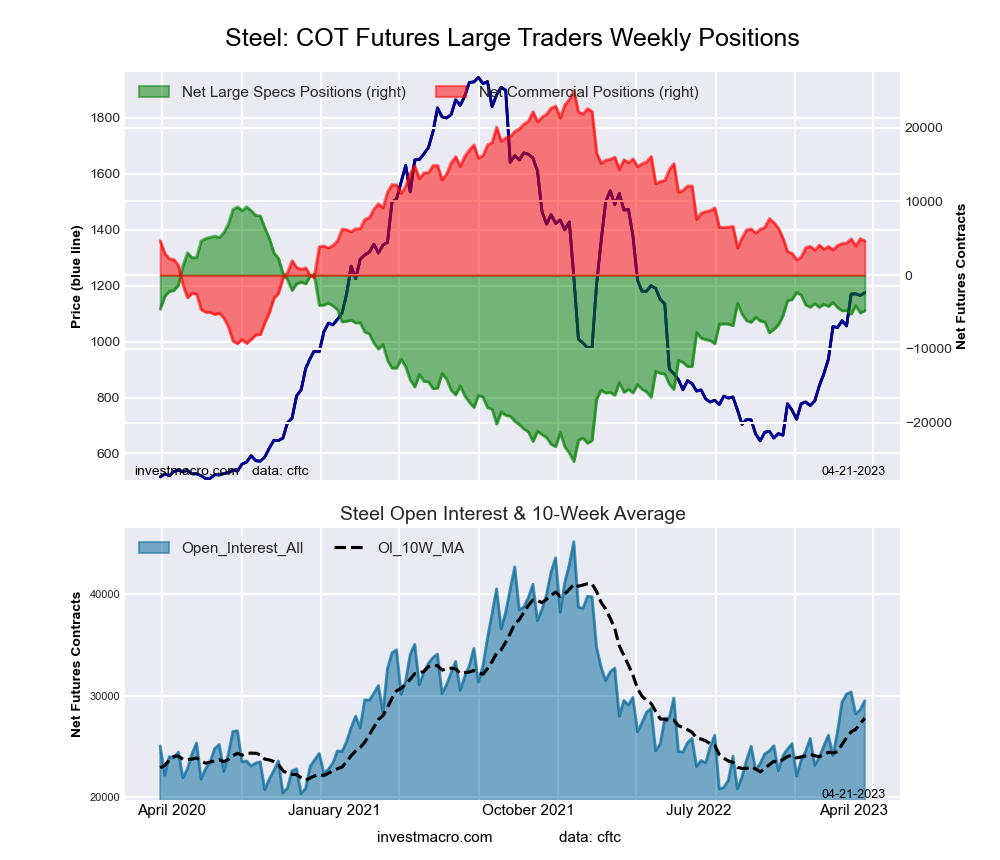
The Steel Futures large speculator standing this week was a net position of -4,779 contracts in the data reported through Tuesday. This was a weekly boost of 329 contracts from the previous week which had a total of -5,108 net contracts.
This week’s current strength score (the trader positioning range over the past three years, measured from 0 to 100) shows the speculators are currently Bullish with a score of 59.3 percent. The commercials are Bearish with a score of 40.5 percent and the small traders (not shown in chart) are Bearish with a score of 38.5 percent.
| Steel Futures Statistics | SPECULATORS | COMMERCIALS | SMALL TRADERS |
| – Percent of Open Interest Longs: | 12.4 | 76.0 | 1.0 |
| – Percent of Open Interest Shorts: | 28.6 | 60.3 | 0.5 |
| – Net Position: | -4,779 | 4,632 | 147 |
| – Gross Longs: | 3,671 | 22,409 | 303 |
| – Gross Shorts: | 8,450 | 17,777 | 156 |
| – Long to Short Ratio: | 0.4 to 1 | 1.3 to 1 | 1.9 to 1 |
| NET POSITION TREND: | |||
| – Strength Index Score (3 Year Range Pct): | 59.3 | 40.5 | 38.5 |
| – Strength Index Reading (3 Year Range): | Bullish | Bearish | Bearish |
| NET POSITION MOVEMENT INDEX: | |||
| – 6-Week Change in Strength Index: | -1.2 | 1.8 | -25.1 |
*COT Report: The COT data, released weekly to the public each Friday, is updated through the most recent Tuesday (data is 3 days old) and shows a quick view of how large speculators or non-commercials (for-profit traders) were positioned in the futures markets.
The CFTC categorizes trader positions according to commercial hedgers (traders who use futures contracts for hedging as part of the business), non-commercials (large traders who speculate to realize trading profits) and nonreportable traders (usually small traders/speculators) as well as their open interest (contracts open in the market at time of reporting). See CFTC criteria here.
More By This Author:
Large Currency Speculators Push Euro Bullish Bets Higher To 7-Week High
COT Bonds Speculators Raise 3-Month SOFR Bets As Eurodollars Are Phased Out
COT Metals Speculators Raise Their Silver Bets For Fifth Week To A 10-Week High


Comments
Log in or sign up to join the conversation.