VIX Remains Relatively Low
SPX Monitoring purposes; Long SPX on 10-29-24 at 5832.92
Our Gain 1/1/23 to 12/31/23 SPX= 28.12%; SPX gain 23.38%
Monitoring purposes GOLD: Long GDX on 10/9/20 at 40.78.

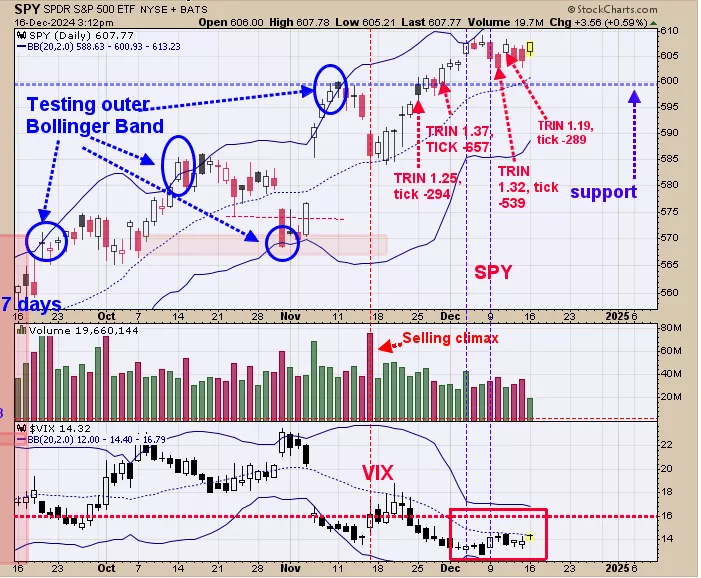
We are up 33%; SPX up 27% so far this year. We noted in red on the chart above the TRIN and Tick closes that reached panic levels which in turn suggests support. Theses panic TRIN and TICK closes came in near the 600 to 604 range suggesting this area is support. VIX remains relatively low near 14 which is an area where trending bull moves are common. Long SPX on 10/29/24 at 5832.92.

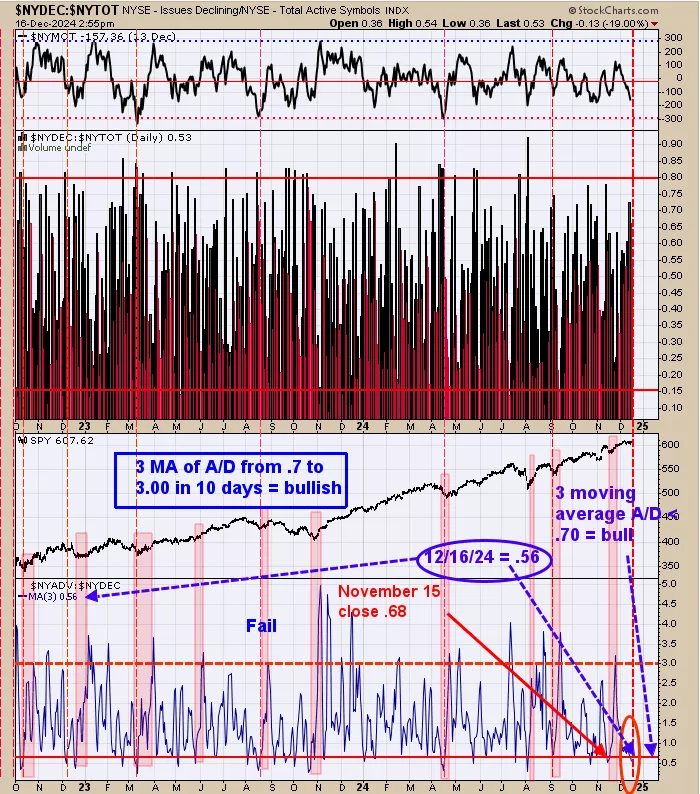
The bottom window is the NYSE advancing/NYSE declining with a 3 day average. The setup is when this indicator closes below .7 and than turns up. We noted previous signals in shaded pink. The last signal came in 11/15/24 which marked the previous low. The current 3 day average of the A/D stands at .56; suggesting another rally is about to begin or has started.
Next Wednesday is Christmas (Merry Christmas) and we will be traveling next Monday and Tuesday. Therefore we may have delayed reports as well as being shorter. Sorry for the inconvenience and have a Merry Christmas.

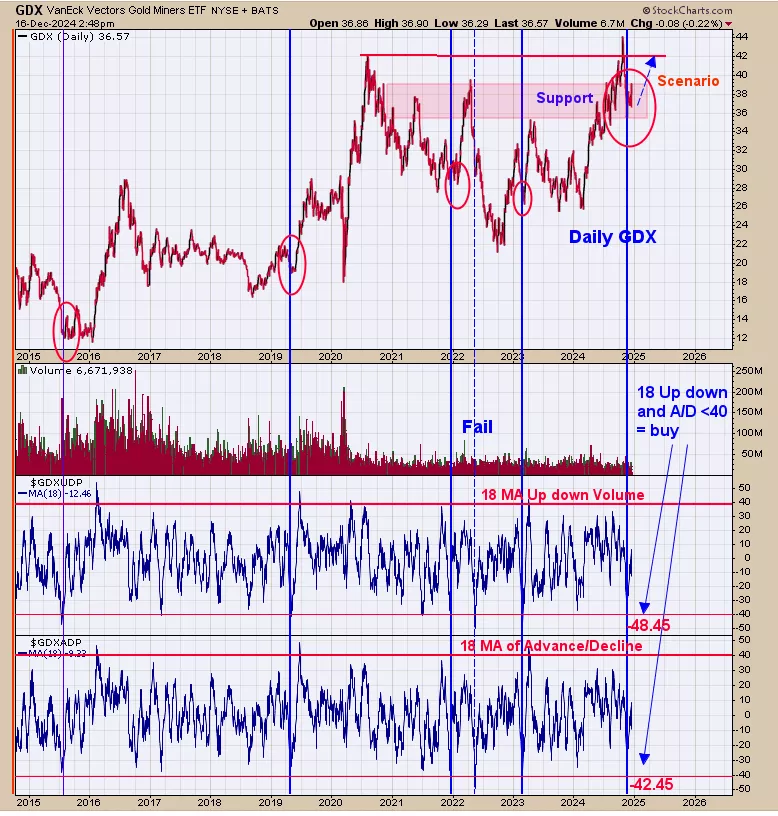
We have shown this chart before and are updated to current data. The bottom window is the 18 day average of the Advance/Decline for GDX and next higher window is the 18 day average of the up down volume for GDX. This chart goes back to late 2014 and we noted with blue lines the times when both indicators hit below -40 (shows exhaustion). The last 10 years these indicators triggered 5 times (not counting current signal), so it’s pretty rare. Of the last five triggers there was on failure in 2022; so there is an 80% probability the current signal (triggered on 11/15/24) will work.
More By This Author:
Rally In SPX Should Continue
Seasonality Is Bullish
Spike In Volume
Signals are provided as general information only and are not investment recommendations. You are responsible for your own investment decisions. Past performance does not guarantee future performance. ...
more


