
SPX Monitoring purposes; Sold SPX on 8/19/24 at 5608.25 = Gain 8.14%gain; Long SPX on 8/5/24 at 5186.33.
Covered short 8/2/24 at 5346.56 = gain 3.18%; Short SPX on 7/31/24 at 5522.30.
Our Gain 1/1/23 to 12/31/23 SPX= 28.12%; SPX gain 23.38%
Monitoring purposes GOLD: Long GDX on 10/9/20 at 40.78.
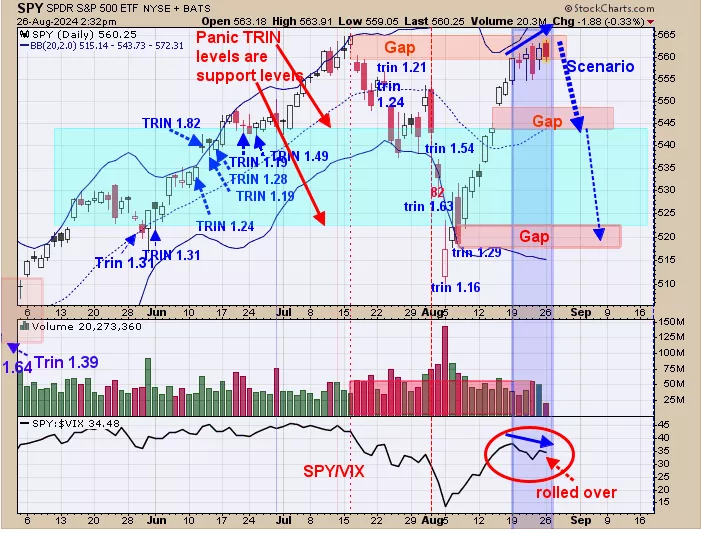
We are up over 26% this year so far; SPX up around 17%. Above is the daily SPY. The bottom window is the SPY/VIX ratio. SPY has been making higher highs and SPY/VIX ratio has been making lower highs and a bearish divergence suggesting a pull back is not far off. There are two gaps below that may be tested in the coming weeks; one near 545 SPY and one near 520. The shaded green area is where the TRIN close came in near 1.20 and higher suggests that area had panic and panic only forms near bottoms and support areas; so we are only looking for a sideways consolidation before the next impulse wave up begins. Sold long SPX on 8/19/24 at 5608.25= gain 8.14%; Long SPX on 8/5/24 at 5186.33.
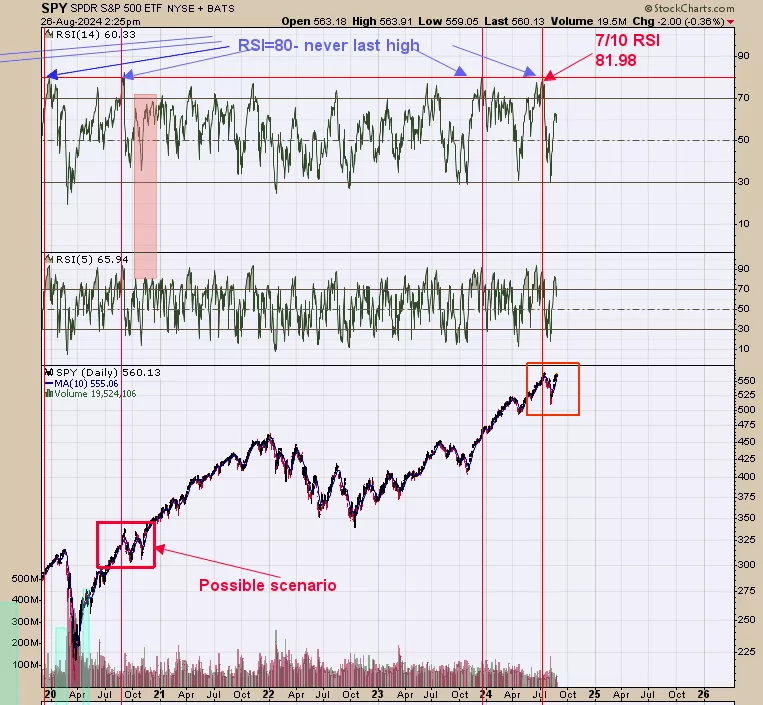
We updated this chart from last Thursday and the commentary still stands, “We showed this chart before but shorten the timeframe to better see what may transpire in the coming weeks. When the RSI for the SPY hit above 80 and but below 85; the market usually stalls short term but is never the final high. On July 10 the RSI closed at 81.98 and pretty much marked the high for the short term for the market. We have an area boxed out in red back in August 2020 which also had an RSI >80 which also stalled the market. There are a lot of similarities between the current RSI >80 and the one in August 2020 and there is a possibility that the current SPY pattern may look similar to the one back in August 2020 when finished. We are still expecting a choppy market for the next couple month but new highs are expected later this year.”
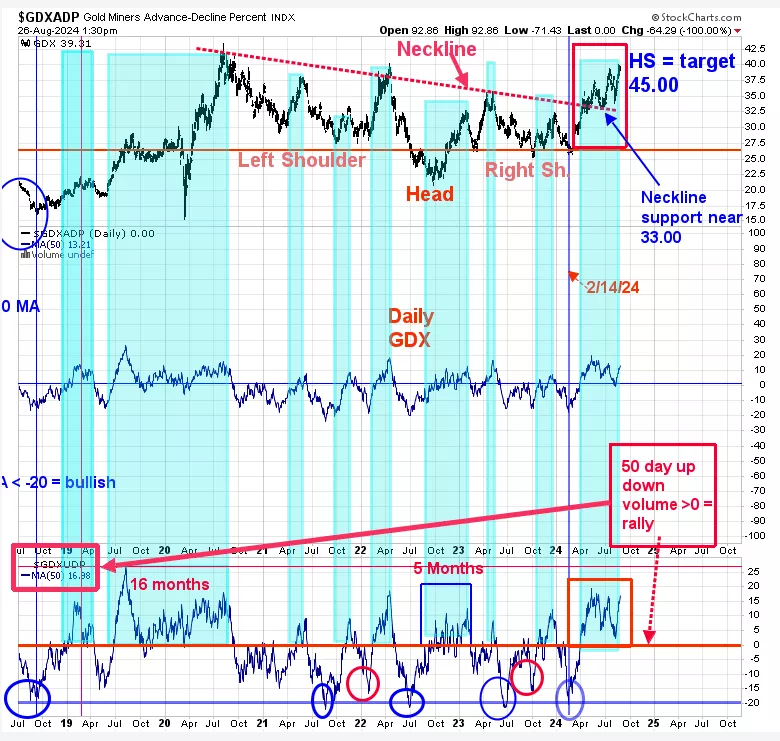
The bottom window is the GDX up down volume percent with a 50 day average. This indicator can give signals that can last several months. The bullish signals for this indicator are triggered when it closes above “0” and bearish when close below “0”. We noted in blue when the times when this indicator is above “0”. This indicator closed above “0” (buy signal) back in March 22 and remains solidly above “0” with a current reading of +16.38 up from last Thursday’s reading of +14.34 which was the last time we showed this chart. The weekly and monthly charts remain on buy signal as well.
More By This Author:
GDX Short Term View
Positive Divergence For Gold And a Pullback For SPY
Large Trading Range


Comments
Log in or sign up to join the conversation.