
Positive Divergence For Gold And A Pullback For SPY
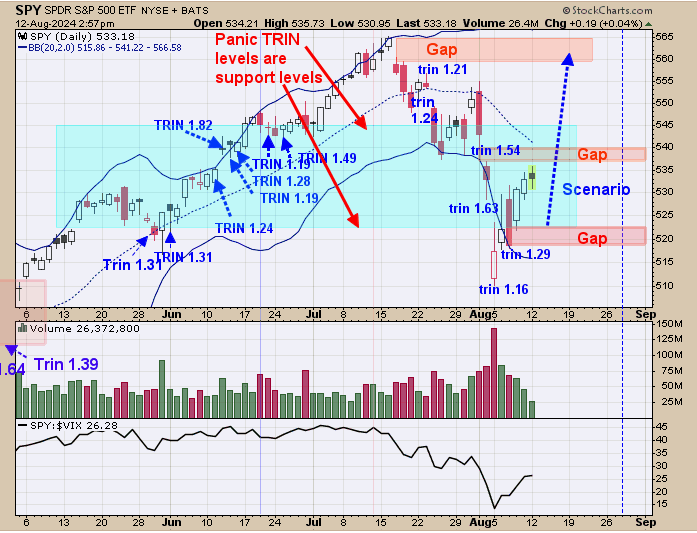
We are up over 20% this year so far; SPX up around 12%. Above is the daily SPY. We noted in shaded blue where the TRIN closes reached near 1.20 and higher. TRIN closes near 1.20 and higher show there is panic in the market and panic only forms near lows. We noted open gaps shaded in pink near the 520, 540 and 560 SPY ranges. All of these gaps may get filled in the next 30 days; so volatility may be in play. In general we expect the gap near 560 to be the next worthwhile high and produce a pull back that may test the August 5 low. This scenario may change as market produces new clues.
(Click on image to enlarge)
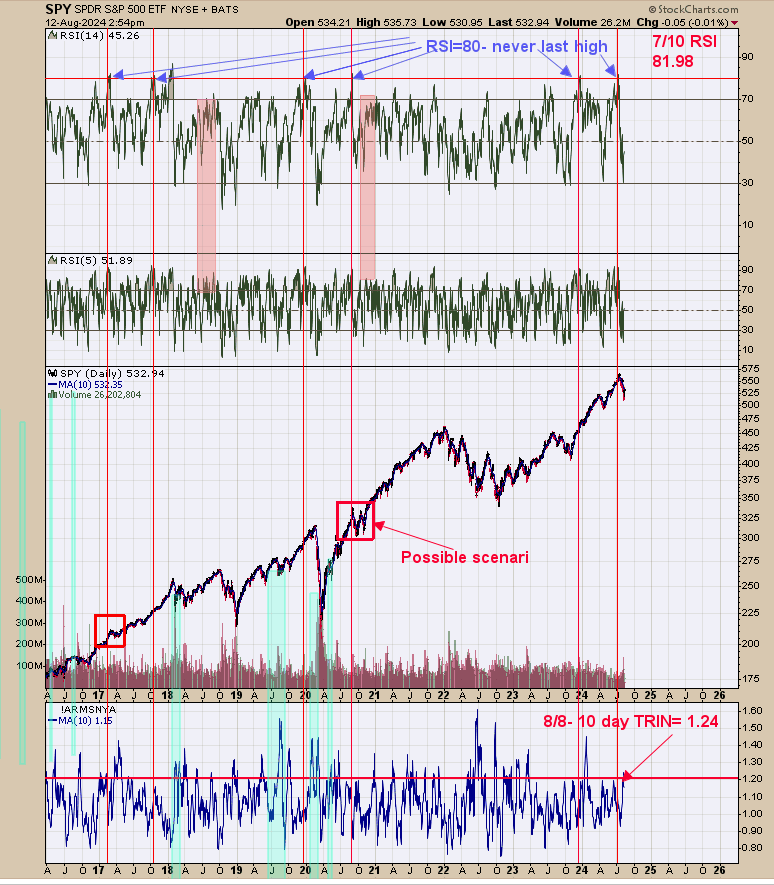
Last week’s commentary still stands and may be the out come for the current market conditions (chart updated today’s trading) “The top window is the daily RSI for the SPY. On July 10 the RSI close at 81.98. RSI closes of 80 to 85 are never the last high in the SPY and at some point the market will work higher.
So an RSI close of 80 and above is a bullish longer term sign but short term can stall the rally. The current RSI close of 81.98 is in the stall the rally mode which can last several weeks. We have two squares on the chart above that may appear similar to current market conditions. We are leaning towards the one in 2020 after the Covid cash.”
(Click on image to enlarge)

The top window is the daily GDX; next lower window is the cumulative up down volume for GDX and bottom window is the cumulative advance/decline. The indicator that seems to work best for positive and negative divergences is the daily cumulative up down volume. Above chart we circled in red the positive divergence where the GDX made lower lows and the cumulative up down volume made higher lows. This positive divergence suggests another rally is about to begin short term for GDX. We noted previous divergences in shaded colors. The weekly and monthly charts remain on buy signal, and the daily chart is showing a positive divergence.
More By This Author:
Large Trading Range
Potential Seasonality Gold Rally
Weak Rally
Signals are provided as general information only and are not investment recommendations. You are responsible for your own investment decisions. Past performance does not guarantee future performance. ...
more

