
SPX Monitoring purposes; Long SPX on 8/5/24 at 5186.33.
Covered short 8/2/24 at 5346.56 = gain 3.18%; Short SPX on 7/31/24 at 5522.30.
Our Gain 1/1/23 to 12/31/23 SPX= 28.12%; SPX gain 23.38%
Monitoring purposes GOLD: Long GDX on 10/9/20 at 40.78.
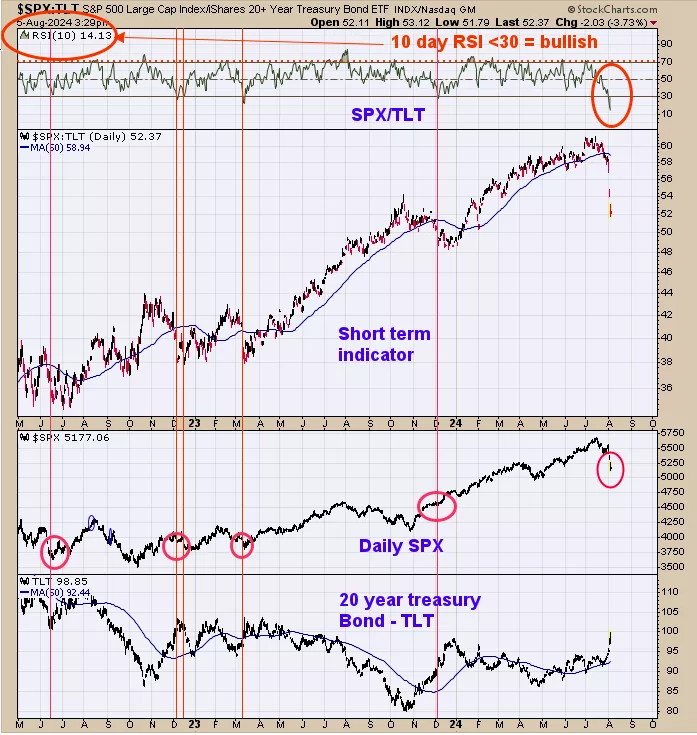
We are up over 18% this year so far; SPX up around 9%. Above is the SPX/TLT ratio. This indicator works well finds lows in the market. When the RSI 10 day reaches below 30 the market is at or near a low; current reading is 14.13. The 10 day TRIN reached 1.21 Friday and also bullish. If the rally does materialize; we don’t think it will last long, possible a month or so. It appears a large trading range is developing. Long SPX on 8/5/24 at 5186.33.
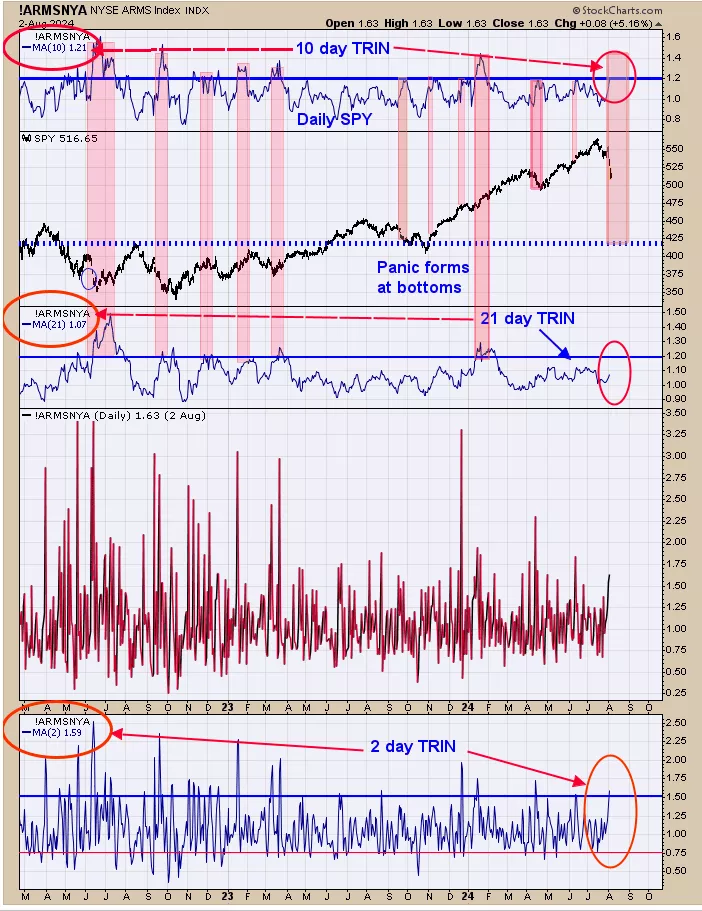
Panic in the market is present which in turn suggests a bottom is in or at a minimum a base is being built. The bottom window is the 2 day average TRIN; readings above 1.50 predict exhaustion to the downside; current reading is 1.59. Top window is the 10 day average of the TRIN; readings of 1.20 and higher predict market is near a low; current reading is 1.21. The middle window is the 21 day average of the TRIN; readings above 1.20 suggest a longer term low is being made; current reading is 1.07. What the trin reading implies is that a short term low is forming but with the 21 day TRIN not at bullish levels, suggests a lasting rally is not in the cards. The current market may be developing a large trading range.
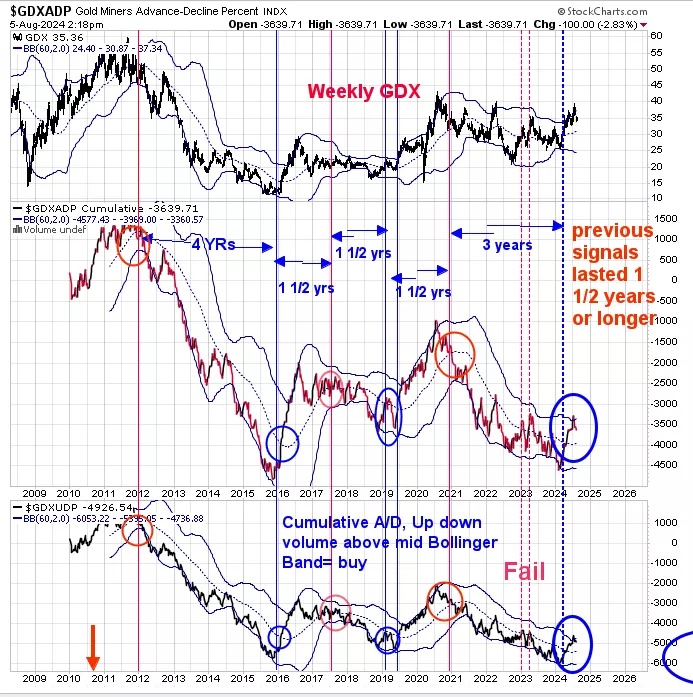
The weekly charts remain bullish and higher highs are expected. The bottom window is the weekly GDX cumulative up down volume and next window higher is the weekly GDX advance/decline. Bullish signals are triggered when both indicators close above their mid Bollinger bands (noted with blue lines). We noted on the chart above how long the buy and sell signals lasted. The last signal (before the current buy signal) was triggered in January 2021 and last to March 2024 (over 3 years). The current weekly buy signal was triggered in March of this year. Signals of this type last at a minimum of 1 ½ years. Adding one and a half years to March 2024 buy signal will give September 2025; again at a minimum but could last much longer.
More By This Author:
Potential Seasonality Gold Rally
Weak Rally
NAAIM Exposure Index


Comments
Log in or sign up to join the conversation.