NAAIM Exposure Index
SPX Monitoring purposes; Sold long 7/12/24 at 5651.01 = gain 10.30%;Long SPX 4/12/24 at 5123.41.
Our Gain 1/1/23 to 12/31/23 SPX= 28.12%; SPX gain 23.38%
Monitoring purposes GOLD: Long GDX on 10/9/20 at 40.78.

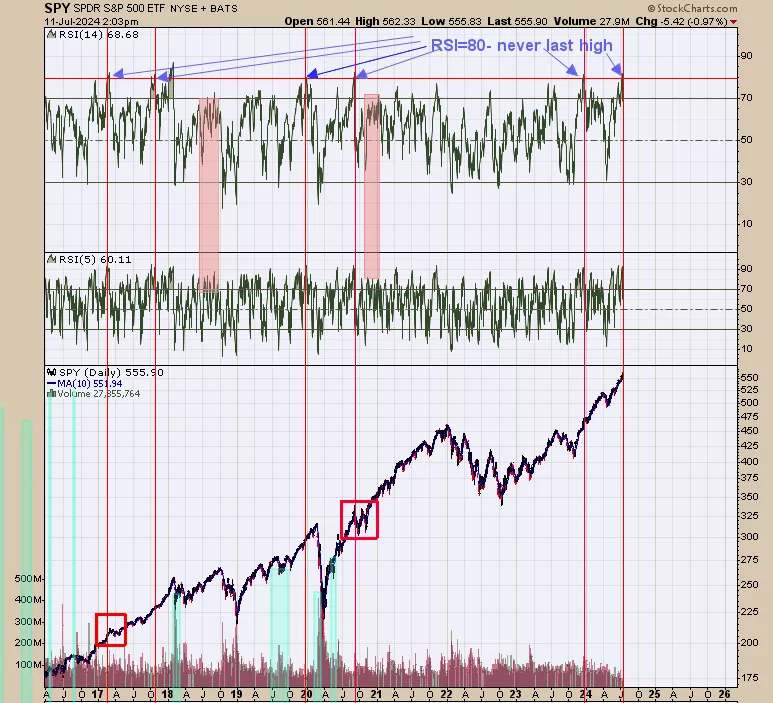
Last Thursday’s commentary is still valid, “Yesterday the RSI (14) for the SPY closed at 81.98; according to history an RSI of 80 is never the last high (shouldn’t use “never” as there is always an exception). When the RSI does reach 80 the market usually stalls short term then later rallies to new highs (can be weeks or months before new high is seen). This RSI >80 example shows you how momentum is an important ingredient in the market. We boxed in red two examples that may play out in the current environment.”

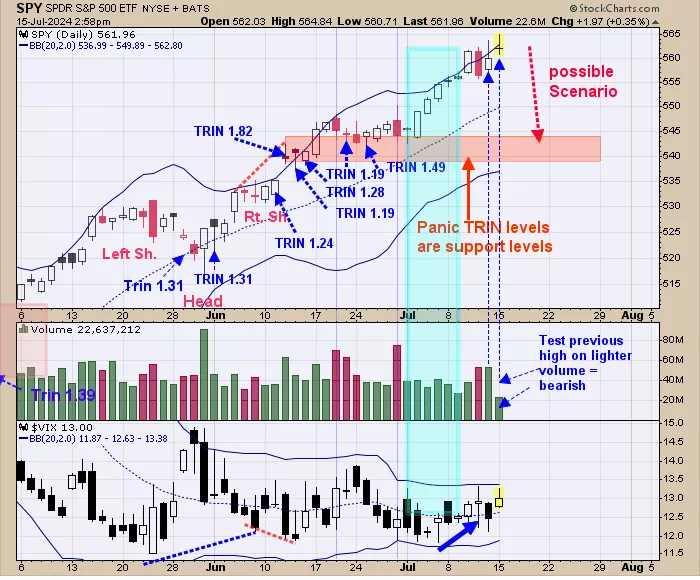
Last week we pointed out the weekly National Assoc. Of Active Investment Managers (NAAIM) exposure index. Last week the weekly NAAIM came in at 103.66% exposure; meaning there are long the market 103.66% which suggests they are on margin of 3.66% and a bearish sign, (see last Wednesday’s report). Above is the daily SPY. Today’s trading tested last Friday’s high on lighter volume and a bearish sign. What may happen next is a pull back. We noted in shaded pink where the TRIN reached panic levels near 1.20 and higher and panic only forms near lows and support areas. That support area on the SPX comes in near 540 range which is about 3.5% lower from current levels. Page one chart suggests bigger trend is up and new highs will be seen at some point. The red box area noted in October 2020 may be what to expect going forward,

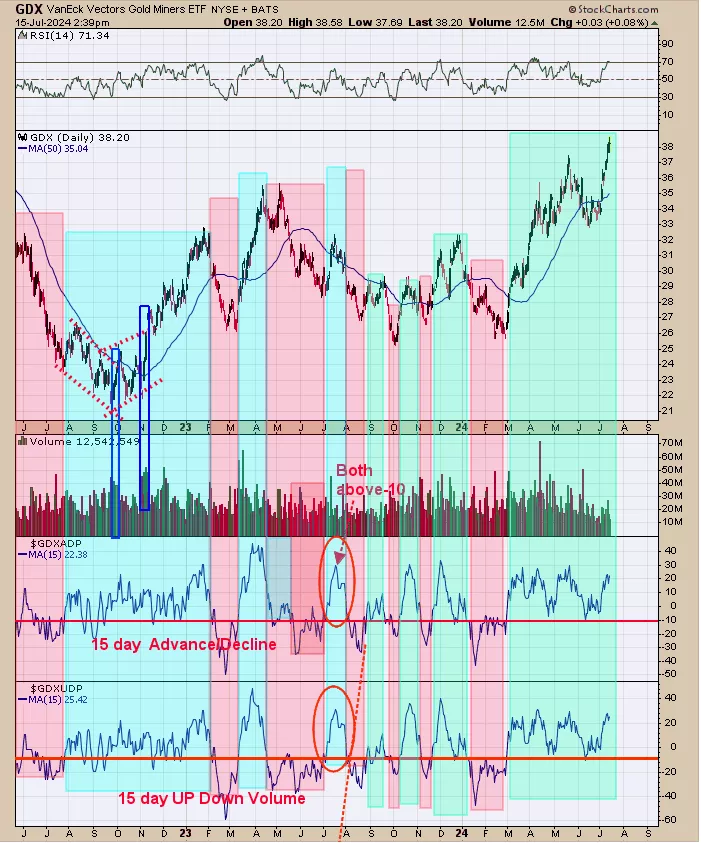
The above chart looks at the shorter term picture. The bottom window is the 15 day average of the up down volume percent for GDX and next higher window is the 15 day average of the Advance/Decline for GDX. Uptrends in GDX are in force when both indicators are above -10 (noted in light green). Both indicators have been above -10 since early March (4 ½ months) and still appear strong as both indicator are well above +20.
More By This Author:
Bullish Period
SPX Shows Bullish Signals
Bigger Picture Remains Bullish
Signals are provided as general information only and are not investment recommendations. You are responsible for your own investment decisions. Past performance does not guarantee future performance. ...
more


