
SPX Monitoring purposes; Sold long 7/12/24 at 5651.01 = gain 10.30%;Long SPX 4/12/24 at 5123.41.
Our Gain 1/1/23 to 12/31/23 SPX= 28.12%; SPX gain 23.38%
Monitoring purposes GOLD: Long GDX on 10/9/20 at 40.78.
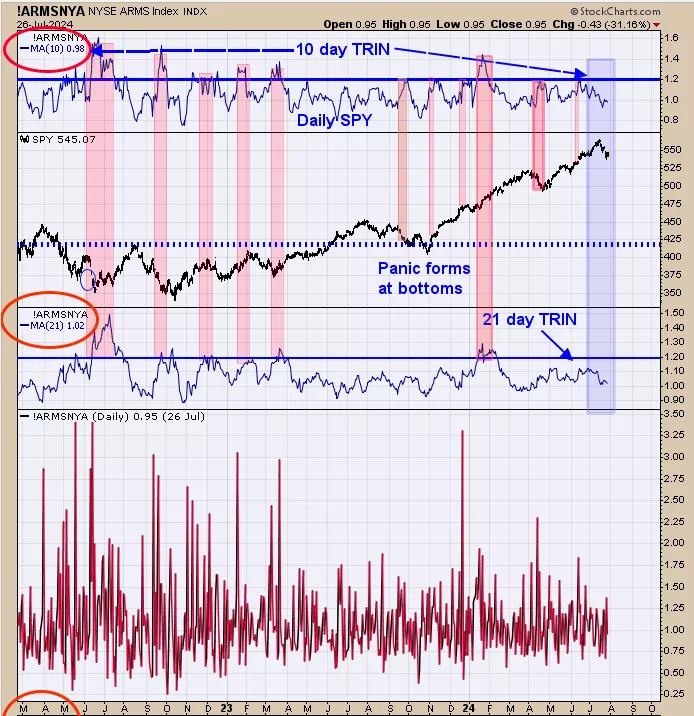
Long SPX on 4/12; sold long 7/12 gain 10.30%. This is the chart that needs to “kick in” for the next low in the SPY. The top window is the 10 day average of the TRIN and below that is the SPY chart. We noted in shaded pink the times when the 10 day TRIN reached 1.20 and higher suggests that level had panic and panic only form near lows in the market. Current 10 day TRIN stands at .98 and need to approach 1.20 or higher to signal a bottom is forming. This process may take a while.
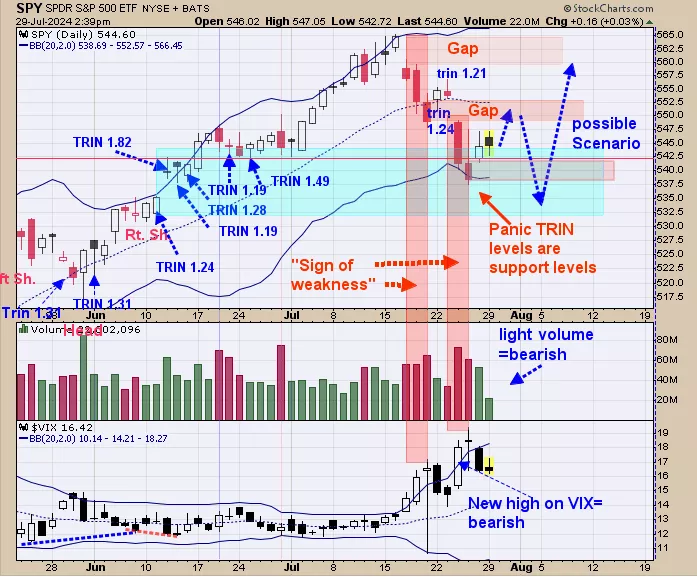
SPY declined over 2% on July 24 (last Wednesday); 2% declines usually come in clusters suggests another 2% decline will be show up soon. The last two day’s trading had lighter volume compared to the two previous down days of last Wednesday and Thursday; trend of the market goes in the direction of the highest volume. The current bounce may find resistance at the open gap near 550. If this gap is tested on lighter volume will suggests resistance. We noted in shaded light green when the TRIN reached near 1.19 and higher suggesting this area had panic and panic only forms near lows. This shaded green area could produce a low in the market if the 10 day TRIN reaches near 1.20 or higher. Bigger trend remains bullish and new highs may be seen later this year. Staying SPX neutral for now.
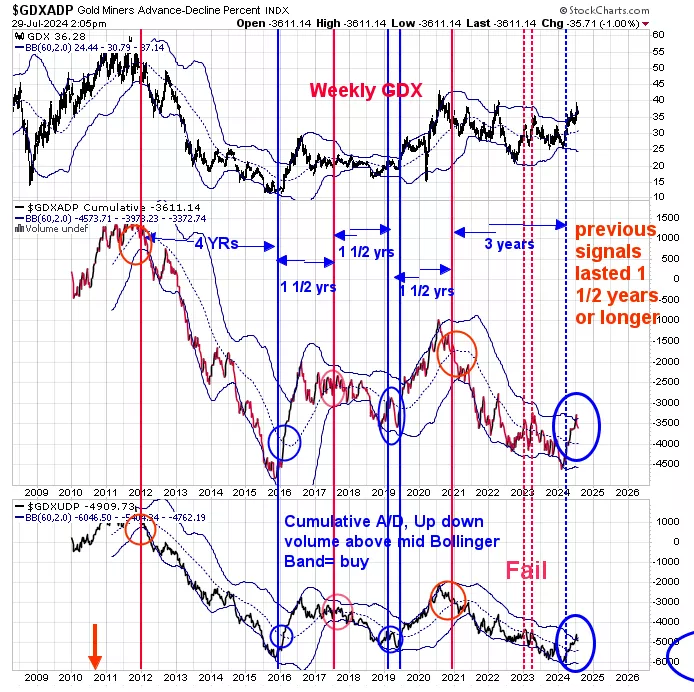
The bottom window is the weekly cumulative GDX Up down volume percent and next higher window is the weekly cumulative GDX advance/decline percent. Signals of this type last one and a half years or longer. Signals are triggered when both weekly indicators close above their mid Bollinger bands (blue circles) and sell signals occur when both indicators close below their mid Bollinger bands ( red circles). The last signal generated by this method came on March 18 of this year. Since most signal last 1 ½ years or longer, the current rally may last into September 2025. Seasonality turns bullish for Gold starting 7/24 and runs to 8/3, next Saturday. The potential seasonality gold rally should help gold stocks short term. The Monthly GDX remains bullish also which was triggered on May 31 of this year.
More By This Author:


Comments
Log in or sign up to join the conversation.