
Seven-Chart Sunday: Feb. 6, 2022
These (more than) seven charts from the past week tell an interesting story about the markets and investing. Let's take a closer look.
1) The Worst Year for Bonds in History?
Entering this year, 1994 was the worst year ever for the bond market, with a loss of 2.9%.

But in a little over a month, US bonds are already down over 3% year-to-date.

What’s going on? Interest rates are rising, with 1-, 2-, 3-, 5-, and 10-year Treasury yields all at their highest levels since the start of the pandemic.

The two primary drivers of this synchronous move higher in yields appear to be:
- The tapering of bond purchases by the Fed, with an expected end to quantitative easing in early March.
- The coming rate hikes which are set to start at the FOMC meeting with a 25 bps increase.
On the second point, the market continues to price in a more hawkish path, with a 65% probability of 5 rate hikes in 2022.

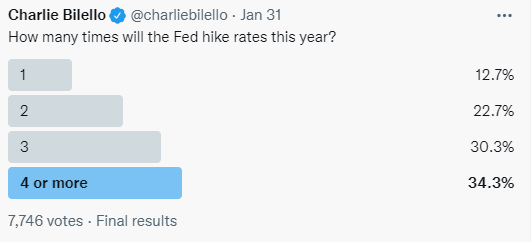
Will the Fed actually meet those hawkish expectations? That depends on many factors (the path of inflation, employment, stocks, etc.).
But looking at the results of a poll I did on Twitter this week, it seems that many are skeptical. The majority of respondents believe that the market is wrong, and the Fed will hike less than 4 times in 2022.
2) The Social Media Boom/Bust
There are few industries that have generated more attention over the last 10 years than social media, with examples like Facebook (FB), Snapchat (SNAP), Twitter (TWTR), Pinterest (PINS), etc. So, it might be surprising to learn that the Social Media ETF (SOCL) has underperformed the S&P 500 ETF (SPY) by over 100% since its inception in 2011.
The swing in sentiment over the last two years has been like nothing we’ve seen before, with a boom for social media stocks when the pandemic first hit (stay-at-home play), followed by a monumental bust over the last year.

What investors were willing to pay for a given level of sales changed dramatically over this time. In March 2020, they were paying less than 5x sales for the average social media company (in the SOCL ETF), which spiked to over 14x sales by February 2021, and then moved all the way down to 6x today.

3) Hello, $30 Trillion
The US National Debt has moved above $30 trillion for the first time. The increase over the last two years: $7 trillion.

With the deficit still running at around $2.5 trillion, we’re likely to see more milestones this year. However, the rate of growth is slowing, with many expecting the deficit to end the year below $2 trillion (assuming no large spending bills are passed). At its peak in March 2021, the deficit hit a record of over $4 trillion.

4) The Greatest Jobs Comeback in History
The January payroll report exceeded expectations (467 thousand new jobs vs. 150 thousand estimate), continuing the greatest jobs comeback in history. In March and April of 2020, 22 million jobs were lost. Since then, 19.1 million have been added back.

The good news for anyone who’s still unemployed: there’s nearly 11 million job openings in the U.S. which exceeds the number of unemployed persons by 4.6 million, a record high.

The shortage of labor continues to be an important factor in the inflationary spiral, with hourly earnings rising 5.7% over the last year. This is still below the current rate of inflation (7%), however, meaning real wages are declining.

5) Earnings Season Sentiment
We’ve seen larger swings in sentiment this earnings than in quite some time, with market participants moving back-and-forth from a state of panic (i.e. Netflix & Facebook) and relief (i.e., Apple, Google, & Amazon).

Overall (with 67% of companies reported), S&P 500 earnings are coming in ahead of estimates and are on pace for another record high.

S&P 500 sales are up 12% over the prior year, still well above the historical average. This rate of growth is going to slow in the coming quarters as comps become more difficult.

Here’s a look at the revenue growth at some of the major US corporations.

6) Stagflationary Shift?
Crude oil moved above $90 a barrel this week for the first time since 2014. During the January correction in stocks, crude oil and energy stocks (XLE) continued to push higher. This divergence in performance is something we haven’t seen in a long time.

The question for investors: are we in the early stages of a shift to a more stagflationary environment (see 1970’s) where commodities outperform stocks?

7) Great Reopening, Part II
COVID-19 cases are plummeting all across the US, down over 65% from their peak in January.

Travel numbers took a big hit with the recent Omicron wave, but with the COVID-19 picture rapidly improving, the lows should already be in. As we approach the spring and warmer weather, the second great reopening is set to take hold.

Note: Charts are sourced and sponsored by YCharts.
Disclaimer: All information provided is for educational purposes only and does not constitute investment, legal or tax advice, or an offer to buy ...
more

