
SPX Monitoring purposes; Long SPX on 2/6/23 at 4110.98
Monitoring purposes GOLD: Long GDX on 10/9/20 at 40.78.
Long Term SPX monitor purposes; Neutral
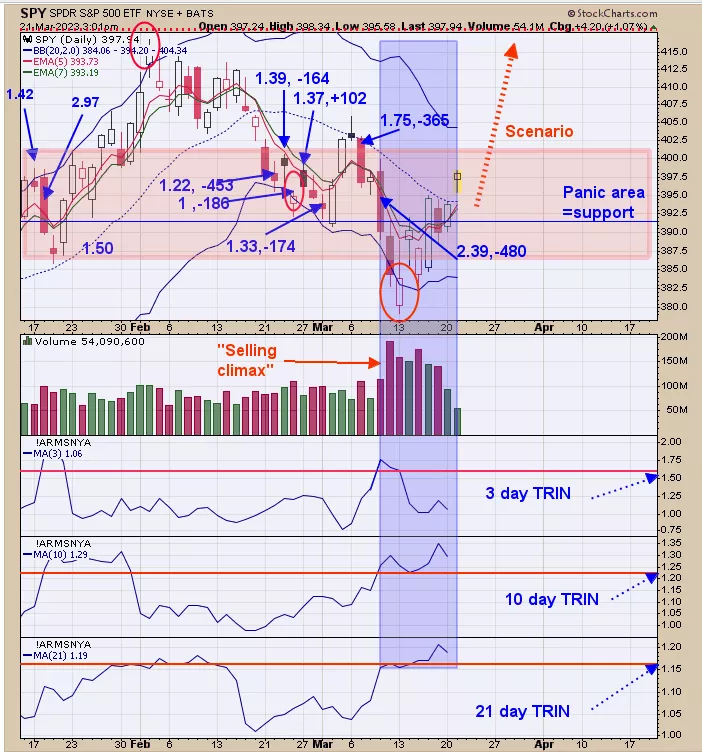
The market is a little messy and I’ll do my best to make it clear to you. The top window is the SPY. We posted the Trin close (first #) and tick close (second #) on the days they reached panic levels. The light-shaded pink areas are where the majority of panic tick and trin closes occurred which in turn suggests support. We also pointed to the “Selling Climax” day on the volume chart. The blue-shaded area shows the times when the 3-day, 10-day, and 21-day TRIN reached a bullish level. In general, this chart shows where panic occurred both in time and price on the SPY. Panic is where market bottoms form.
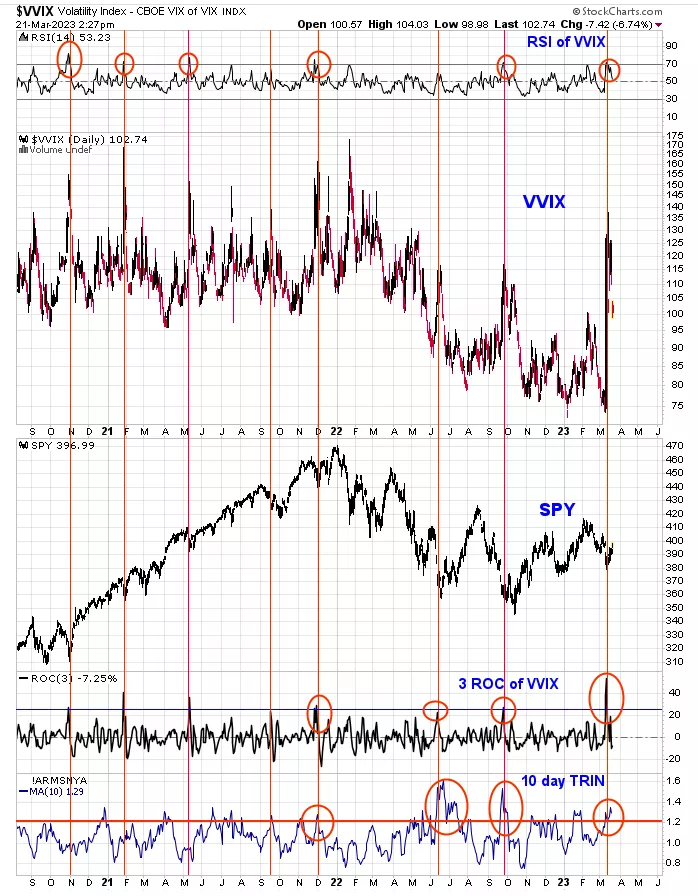
I’m a big fan of panic and the higher degree of panic the more durable the bottom in the market. Above is the VVIX (Vix of the Vix). The VIX and the VVIX is considered fear gauge and fear is a form of panic. The VVIX had a big jump in mid-March, suggesting a big jump in Fear (panic). To measure the degree of fear in the VVIX compared to other times, we used the “Rate of Change” (ROC), and RSI on the VVIX. In previous times when the ROC reached above 20 and the RSI above 70 (noted with red lines) the market produced a decent rally. A couple of times the market retested the low before rallying higher and that could happen here. Notice that the ROC of the VVIX at the recent low reached over +50 and the highest ROC reading went back to mid-2020. The +50 ROC of the VVIX suggests the highest panic and in turn a durable bottom. The bottom window is the 10-day average of the TRIN; readings above 1.20 have formed near market bottoms and the current reading is 1.29 which adds to the bullish sign. The FOMC announcement comes tomorrow and it appears whatever the announcement is, it’s already baked into the cake.
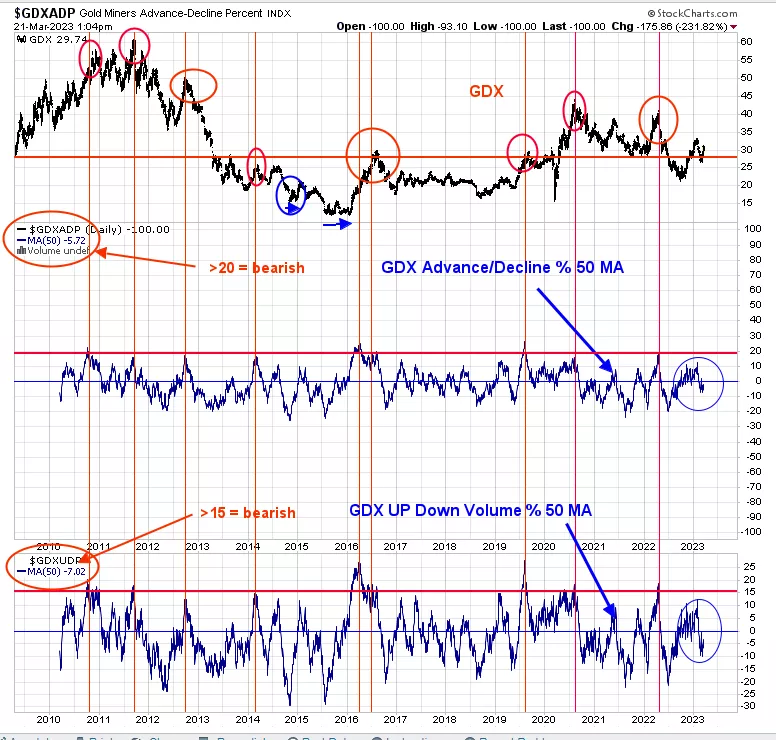
The bottom window is the 50-day average for GDX Up down volume percent and the next window up is the 50-day average for GDX Advance/ decline percent. We use both indicators in helping to find intermediate-term lows. The last bullish signal by these indicators came back in July of last year. Both indicators have a good record of identifying intermediate-term highs. It turns out that when a 50-day average of the Up down volume percent (bottom window) reaches above +15 and when a 50-day average of the Advance/Decline percent (Next window up) reaches +20; GDX has been at an intermediate-term high. Most sell signals were proceeded by a buy signal about six months later. As of now, both indicators are well below their sell levels suggesting the current rally can continue. When this market gets “exuberate” when these indicators reach bearish levels.
More By This Author:
A Lot Of Panic
Weekly XAU/Gold Ratio
Nasdaq McClellan Oscillator


Comments
Log in or sign up to join the conversation.