
Nasdaq IShares Biotechnology ETF (IBB) Elliott Wave Analysis
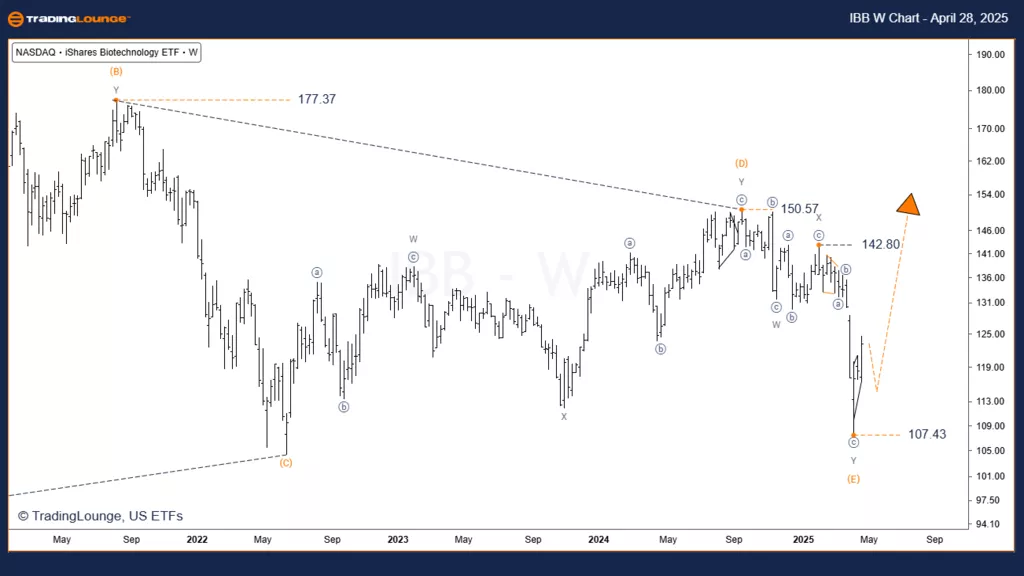
IBB Weekly Chart – Elliott Wave Technical Analysis
Function: Major Trend
Mode: Motive
Structure: Triangle
Position: Wave [4]
Direction: Uptrend
Details:
The wave [4] triangle in IBB appears completed, signaling a major buying opportunity.
Following the triangle, a post-triangle thrust is developing, typically marked by strong impulsive behavior.
We are currently in wave (1) of [5], aiming for an initial target around $150 before wave (2) correction begins.
A clear confirmation level for this outlook lies at $142.80.
Invalidation Level: $107.43
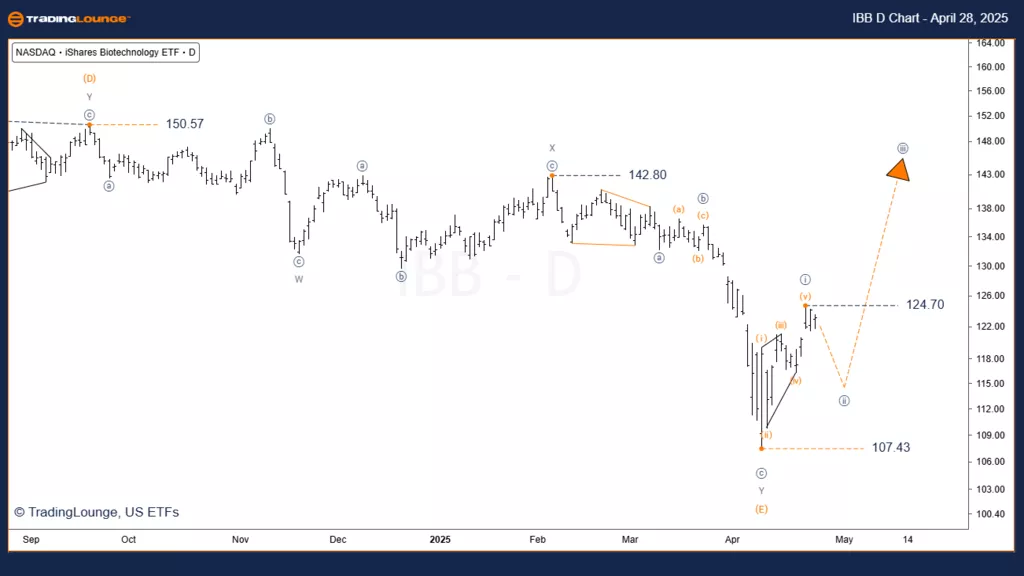
IBB Daily Chart – Elliott Wave Technical Analysis
Function: Major Trend
Mode: Motive
Structure: Impulse
Position: Wave [ii]
Direction: Minor Decline
Details:
The current decline is considered a temporary pause within a larger rally.
Wave [ii] may retrace a significant part of the leading diagonal but is not expected to invalidate the bullish setup.
After completion, the next move is forecasted to be impulsive toward $142.80.
Invalidation Level: $107.43
Conclusion
The ongoing rally in IBB is in its early stages and is likely to be extensive, given the nature of a post-triangle thrust.
IBB is expected to retrace the full triangle and potentially surpass it.
This setup represents an excellent buying opportunity for ETF investors.
Traders should closely monitor Elliott Wave structures and respect invalidation levels to manage risk effectively.
Technical Analyst: Simon Brooks
More By This Author:
Elliott Wave Technical Forecast: Block, Inc. - Monday, April 28
Elliott Wave Technical Analysis: JPMorgan & Chase Co. - Monday, April 28
Elliott Wave Technical Analysis: British Pound/Australian Dollar - Monday, April 28
At TradingLounge™, we provide actionable Elliott Wave analysis across over 200 markets. Access live chat rooms, advanced AI & algorithmic charting tools, and curated trade ...
more

