
JP Morgan & Chase Co. (JPM) – Daily and 1H Chart Analysis
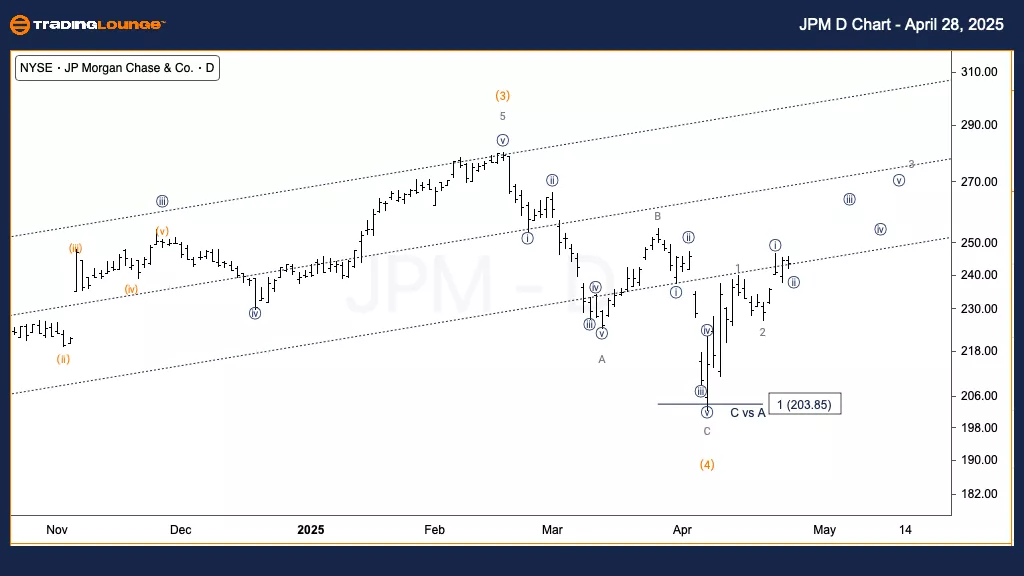
JPM Elliott Wave Technical Analysis – Daily Chart
Function: Trend
Mode: Impulsive
Structure: Motive
Position: Wave 3
Direction: Upside in wave 3
Details:
JPMorgan (JPM) appears to have completed wave 2, setting the path for further upside within wave 3 of Primary wave (5). The focus is now on reaching TradingLevel3 at $300, with expectations of continued bullish momentum as wave 3 advances.
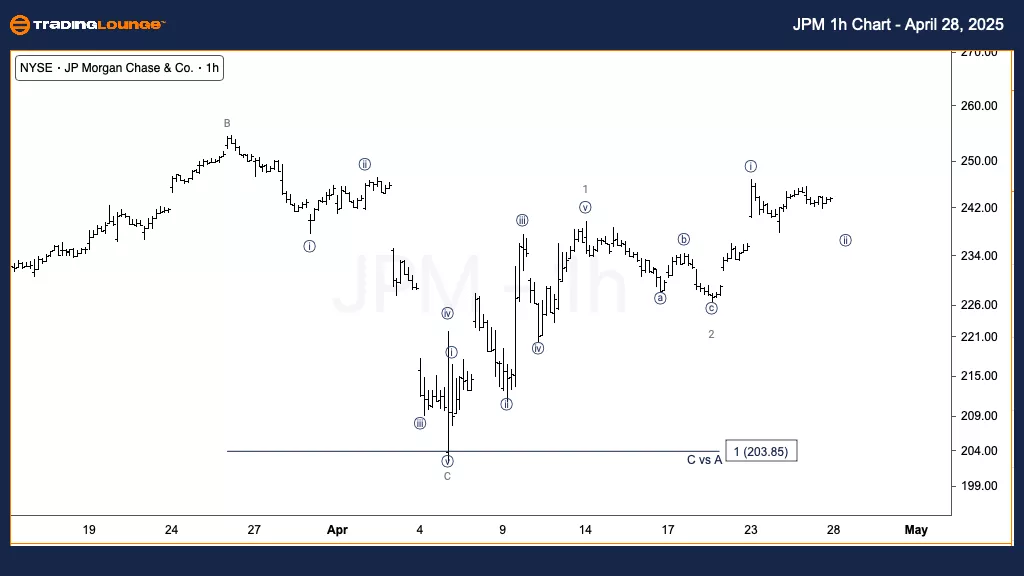
JPM Elliott Wave Technical Analysis – 1H Chart
Function: Trend
Mode: Impulsive
Structure: Motive
Position: Wave {ii} of 3
Direction: Bottom in wave {ii}
Details:
On the 1-hour chart, JPM is nearing the completion of wave {ii} of 3, setting the stage for a possible strong third-of-a-third rally. Alternatively, there is a minor chance that price action is within wave (iv) of {i}. Despite the alternate view, the bullish structure remains intact, favoring a move higher once the current corrective phase concludes.
Market Summary
This Elliott Wave analysis for JP Morgan & Chase Co. (JPM) covers both the daily and 1-hour charts, offering a detailed view of the ongoing market trend through Elliott Wave Theory. It projects the next potential bullish moves while acknowledging possible short-term alternatives.
Technical Analyst: Alessio Barretta
More By This Author:
Elliott Wave Technical Forecast: Block, Inc. - Monday, April 28
Elliott Wave Technical Analysis: British Pound/Australian Dollar - Monday, April 28
Elliott Wave Technical Analysis NEO Crypto Price News Today


Comments
Log in or sign up to join the conversation.