
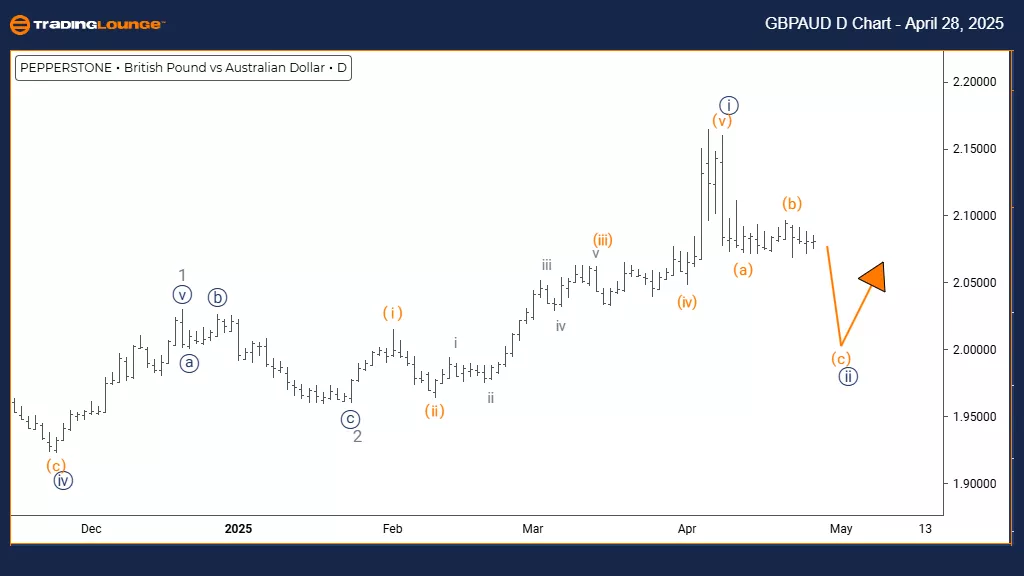
British Pound / Australian Dollar (GBPAUD) – Day Chart
GBPAUD Elliott Wave Technical Analysis
Function: Counter Trend
Mode: Corrective
Structure: Navy Blue Wave 2
Position: Gray Wave 3
Direction Next Higher Degrees: Navy Blue Wave 3
Details:
Navy blue wave 1 appears complete, and navy blue wave 2 is currently developing.
The GBP/AUD day chart analysis reveals a counter-trend correction forming inside a broader downward structure. The currency pair has finalized its navy blue wave 1 decline and has now entered the navy blue wave 2 corrective phase, which fits into the larger gray wave 3 downtrend. This current structure indicates a short-term upward retracement is occurring before the main bearish trend is expected to resume.
Navy Blue Wave 2 Correction Phase
Navy blue wave 2 is the corrective phase that often retraces between 38% to 61% of the previous wave 1 drop. The end of wave 1's downward movement set the stage for this pullback, typically featuring overlapping price action and less momentum—hallmarks of corrective waves. The daily time frame suggests this correction might serve as a medium-term pause within the dominant bearish sequence.
The expected next move would be the downward navy blue wave 3, following the completion of wave 2. This wave 3 is anticipated to be the most powerful phase of the sequence, likely pushing significantly lower than wave 1's previous bottom. Traders should carefully monitor the development of wave 2, watching for classic signs of a termination such as bearish reversal patterns and momentum indicators reaching overbought levels.
Trading Opportunities and Technical Insights
This corrective stage offers potential setups for those aiming to position for the forthcoming wave 3 decline. Applying technical analysis tools will be crucial to confirm the end of the correction and the start of the new downward move. The chart structure hints that the pair could soon finish this corrective action and prepare for its next major bearish leg.
Close attention to price behavior around Fibonacci retracement levels will be key for pinpointing optimal entry points as the shift from wave 2 to wave 3 occurs. The overall daily outlook highlights the importance of this correction in the broader bearish trend context.
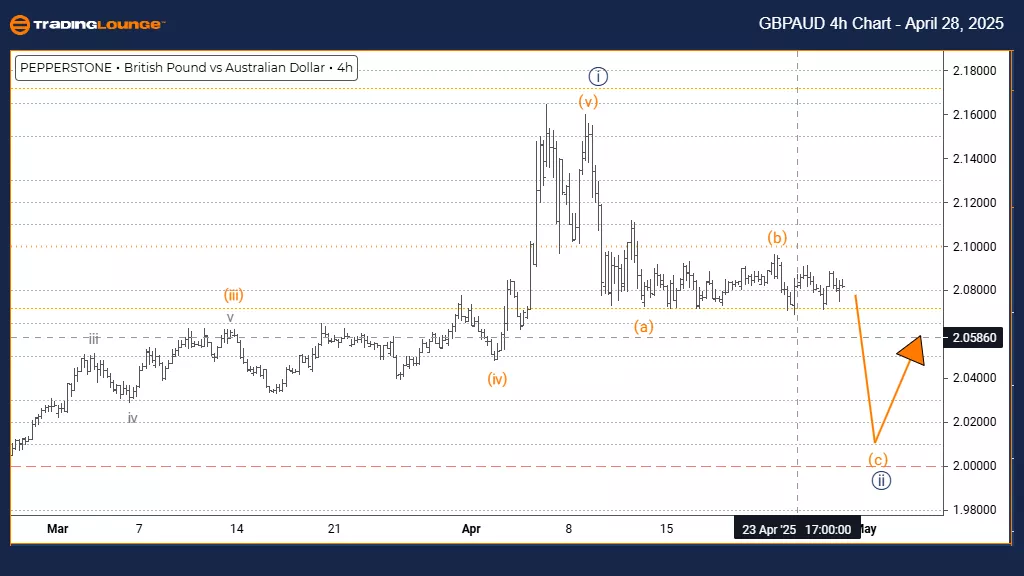
British Pound / Australian Dollar (GBPAUD) – 4 Hour Chart
GBPAUD Elliott Wave Technical Analysis
Function: Counter Trend
Mode: Impulsive as C
Structure: Orange Wave C
Position: Navy Blue Wave 2
Direction Next Higher Degrees: Navy Blue Wave 3
Details:
Orange wave B appears complete, and orange wave C of 2 is now developing.
The GBPAUD 4-hour chart analysis highlights a counter-trend correction forming within a larger bearish framework. The pair has completed the orange wave B retracement and has moved into orange wave C, part of the broader navy blue wave 2 structure. This position signals the final upward move of the correction before the dominant bearish trend is likely to continue.
Orange Wave C Progression
Orange wave C represents the final phase of this counter-trend corrective move, typically displaying strong momentum as it concludes the structure. With wave B completed, the setup allows for a powerful advance, possibly driving prices notably higher before finalizing the correction. Current indicators suggest that this upward momentum will persist strongly until the corrective sequence wraps up.
Following the end of orange wave C, the next expected move is a navy blue wave 3 decline. This downward wave is projected to renew the dominant bearish trend, likely pushing prices lower and completing the overall corrective framework. The 4-hour view offers essential insights, showing that the pair remains in a short-term counter-trend move within a broader downtrend.
Trading Strategy and Technical Considerations
Market participants should carefully monitor wave C’s characteristics, looking for sustained momentum and a clear progression. This setup offers traders preparation time for when the primary bearish trend resumes. Utilizing technical indicators and identifying price action signals will be key to confirming the end of the correction.
This counter-trend phase gives opportunities for traders looking to align with the next major move once navy blue wave 3 begins. Observing price behavior meticulously will be vital for signaling when the corrective pattern concludes and the new bearish impulse initiates. The current setup suggests that GBPAUD could soon transition into a significant directional move.
Technical Analyst: Malik Awais
More By This Author:
SP500, Big Tech Stocks — Wave Counts, Trade Setups, Key Earnings Drivers
Elliott Wave Technical Forecast: Newmont Corporation - Friday, April 25
Elliott Wave Technical Analysis: Spotify Technology S.A.


Comments
Log in or sign up to join the conversation.