
Hoping For Gains? I'm Buying Quality Utilities For Steady Growth
Summary
- I prioritize quality utilities and ETFs with growing earnings and net worth for combined capital gains and income, rather than high-yielding income stocks with high expense ratios.
- The market in 2025 will continue to be volatile, with ongoing trade tensions and tariffs impacting consumer costs and market stability.
- FXU, an actively managed utility ETF, outperforms its low-expense counterparts, offering superior returns and strategic holdings.
- I am diversifying into utilities, preferred shares, multinational firms, precious metals, and managed futures to navigate market uncertainties and achieve steady returns.

Your nest egg? Source: Grok AI
This is not an analysis of the highest-yielding income stocks or any agglomeration via ETF, CEF, or fund that caters to investors who want yield at any cost.
By that, I do not mean any “price.” Price is what you pay initially. Cost is what you pay when you find the expense ratios of many such products are horrific, or that you are being paid via a large return of capital rather than the income your investment earns, and you didn’t realize there might be tax implications you were unprepared for.
I prefer to have a lesser dividend flow, but own companies and ETFs that also increase their earnings and net worth, allowing me to enjoy capital gains as well as income, the combined result I see as providing more cash in our coffers than dividends alone. Quality utilities are what the doctor ordered.
The Market in 2025
Let’s take a look at where the US markets stand so far in 2025. Most investors are breathing a sigh of relief that there is yet another 90-day time-out in the US-China battle for economic supremacy. The weekend’s meeting is considered great news. “All is now well!” cry many analysts and investors.
No, it isn’t. US importers are still paying tariffs (read: taxes) of 30% on Chinese goods (for 90 days unless someone in the executive branch changes President Trump’s mind). Those importers can’t afford an extra 30%, so they will pass that on to the wholesalers, who pass it along to the sellers, who pass it along to the consumer – that’s you and me.
The markets have been in turmoil since the beginning of the year. We humans have brains wired to remember recency over primacy. That means we remember the recent past better than the distant past, even if the distant past (whether a month distant or a year or more) was much more meaningful and important.
That is why, at yesterday’s close, many were singing, “Happy Days are Here Again!” thinking we have now moved on to a breakout.
But here is where the market, as measured by the S&P, really was yesterday:
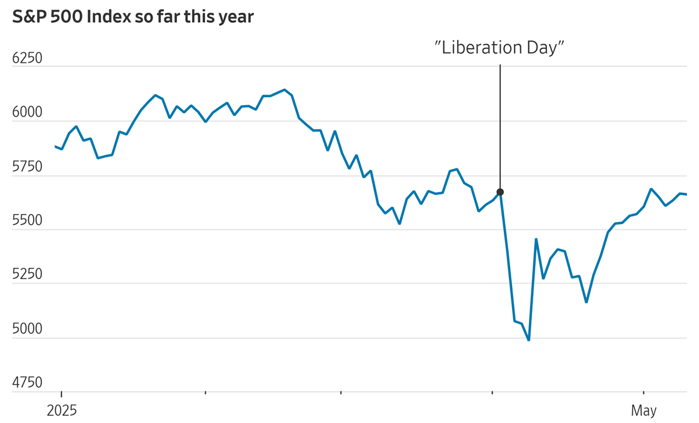
FactSet
The S&P entered 2025 around 5850, rose to slightly above 6100, declined steadily until early April, rebounded the last half of April, and continued to rise in May. After all the back and forth, up and down, and sturm und drang, 5 months into the year, we were below where we started.
“So far” today, as of this writing, we just reached a new high for the year! One point above where we began.
We could as easily have simply bought some fine quality ETFs that are comprised of low volatility holdings, that pay good and likely to rise dividends, and without all the emotion and commotion, left us calmer and richer than that one point has.
While no one knows where the market goes from here, I see it as overhyped and overvalued. We cannot dismiss the potential trauma and turmoil that is likely to accompany the decisions made over the coming months.
I expect the rest of the year to be similarly up and down.
Most investors are now riding the Big Roller Coaster. The NASDAQ was up more than 4% yesterday. (But down more than 10% since April 1st.) It is, so far, up again today.
I am not interested in playing this game.
Does this mean I am doomed to see mediocre returns for the immediate future? I don't think so.
The #1 holding of one of our boring utility ETFs is NRG Energy. It soared 25% yesterday based on a killer increase in earnings. This is a Steady Eddie investment that also did exceedingly well in the last quarter.
Why are utilities one of my bedrock investments?
- More people are using more gas, oil, and electric power than ever before because we have considerably more electronic geegaws in our homes and at our workplaces.
- More people are using more gas and electric power than ever before because we are seeing more weather extremes we are not willing to deal with. “Back in the day,” people just put on more layers of clothing or that favorite ugly bulky sweater if it got too cold. Now most folks just tell Siri or Alexa to turn up the thermostat. Ka-ching, ka-ching.
- Isn’t AI fun? We can ask any question and get an answer ASAP. But this instant transmission of information (not to be confused with knowledge!) requires massive amounts of data to be constantly input, updated and disseminated. This means more data centers and bigger data centers, all of which require, thank you, Tim the Tool Man Taylor, MORE POWER.
We have a choice of many ETFs that own utilities. I have selected the one with the highest expense ratio. Why? Because I believe the choices the ETF sponsor has made, and the order of weighting they have made, will provide the best results going forward.
FXU -- First Trust Utilities AlphaDEX Fund
FXU has an expense ratio of 0.63%. The Utilities Select Sector SPDR® Fund ETF (XLU), the Vanguard Utilities Index Fund ETF (VPU), and the Fidelity MSCI Utilities Index ETF (FUTY) charge, respectively, just 0.08%, 0.09%, and 0.08%.
What do you get for your money in these funds?
Over the past three years, here are the returns you would have enjoyed (not including dividends of 2-3%) in these three low-expense funds and in FXU:
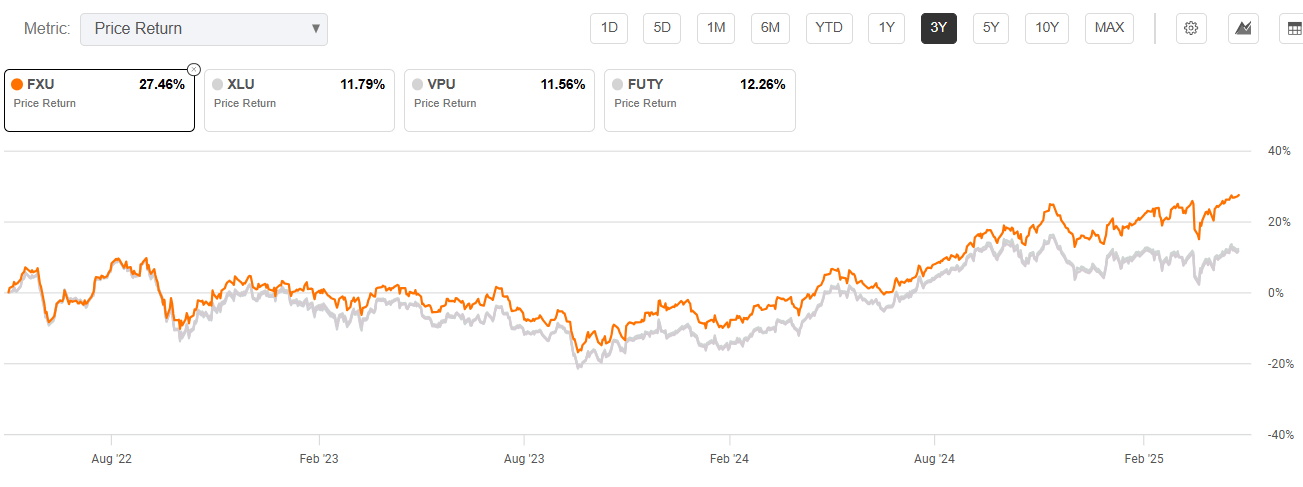
Seeking Alpha
FXU returns were more than double the other three funds.
Over the past year…
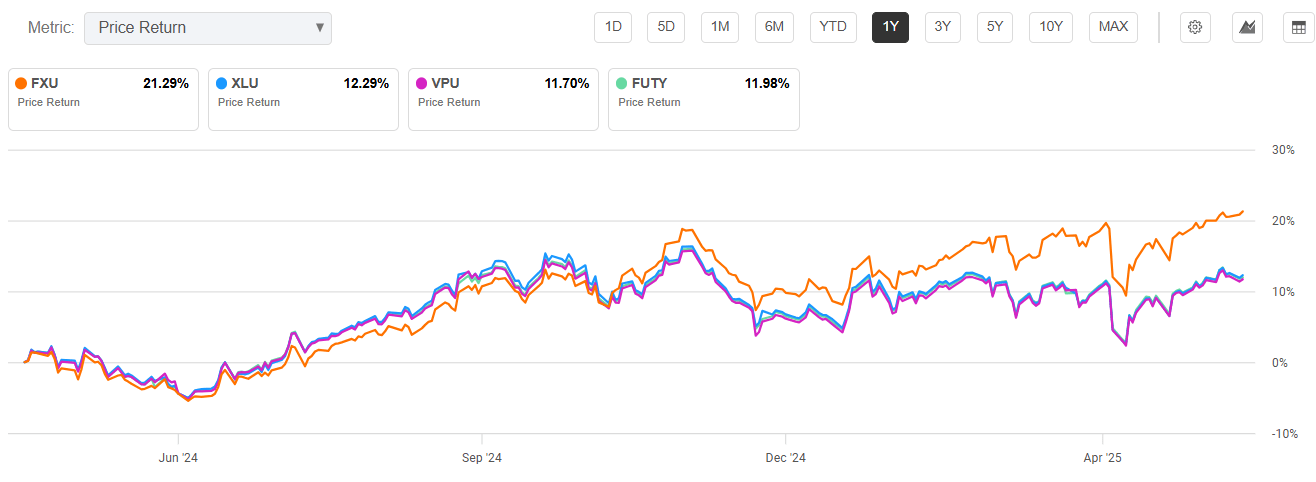
Seeking Alpha
FXU still has a commanding lead.
If it looks like the other three funds seemed to perform in lockstep, it is because they did, and do, march together. Each has the same indexed portfolio with only minor changes based on when they bought or sold shares as a result of investors’ purchases or withdrawals.
Only FXU is actively managed, and from the results obtained, it seems to be very well actively managed. Here is the complete list of holdings of XLU, the biggest of the three index ETFs. VPU and FUTY are basically the same.
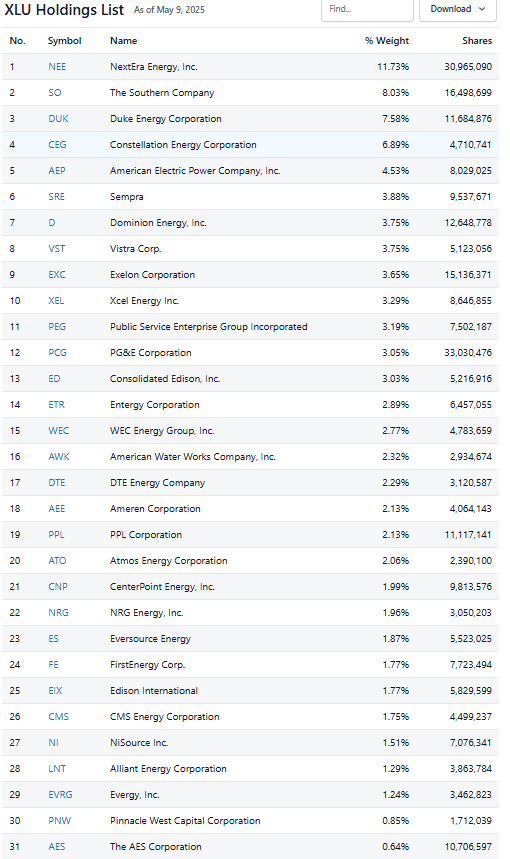
Stock Analysis
Here are the utility holdings of FXU:
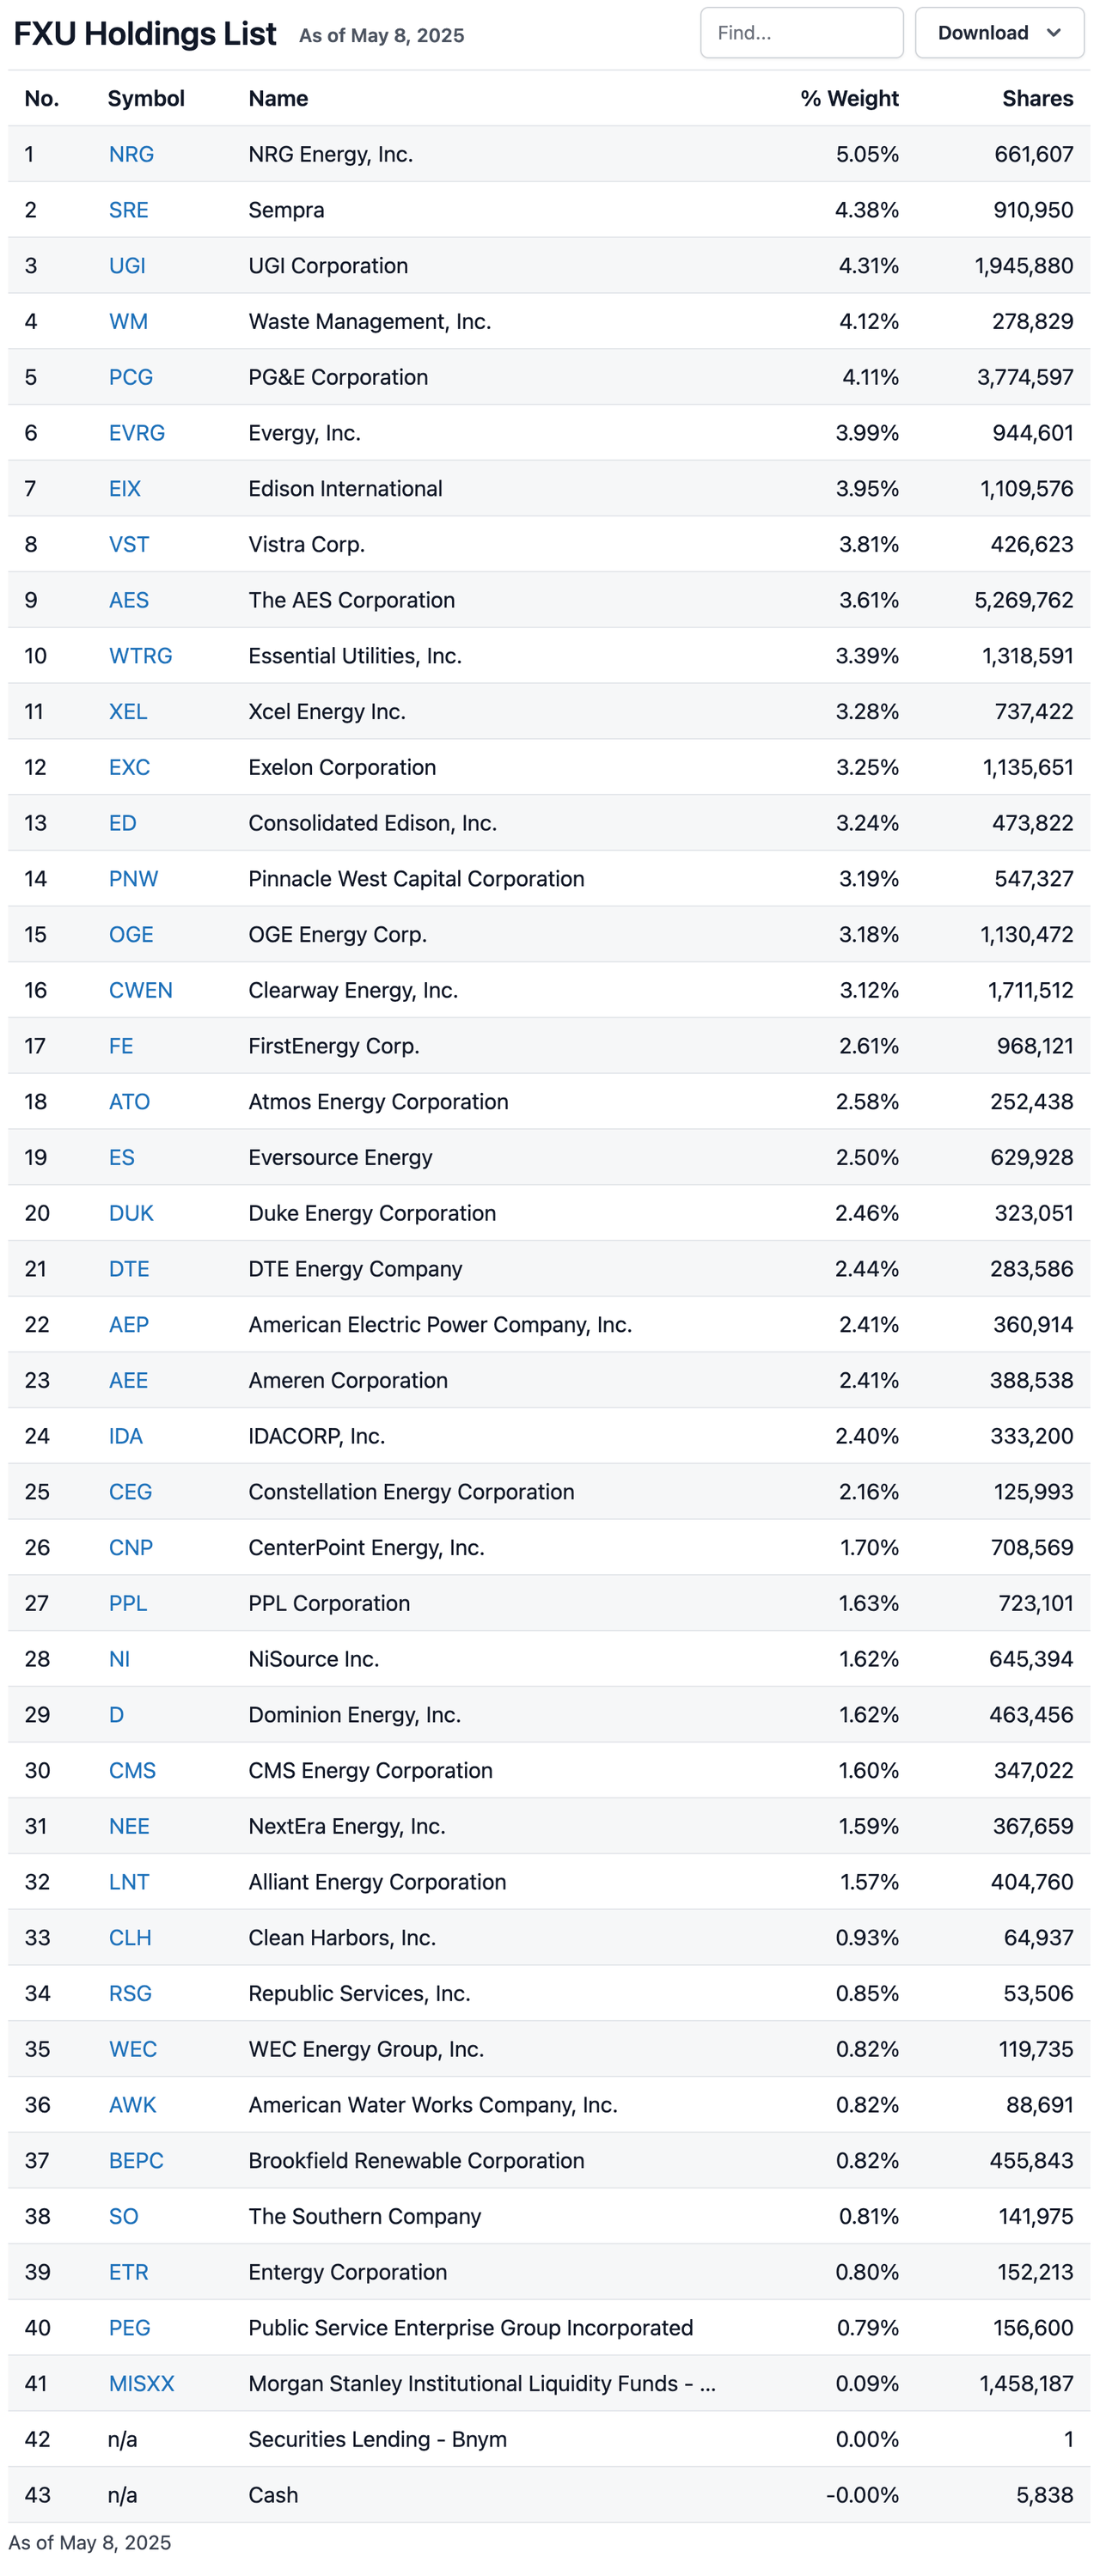
Stock Analysis
In this case, active management counts. You will notice that FXU includes Waste Management (WM) and Republic Services (RSG) as well as some electricity resellers as utilities. I consider that appropriate. These firms are regulated and serve a particular community via a contract that typically has no competitor in the same area, very similar to the other regulated public utilities.
Taking one example, NextEra Energy (NEE) occupies the 1st place on all the other indexed utility funds -- simply because it has the highest market capitalization. FXU places it as number 31 out of 40.
All of the above is why I own FXU.
Where Does the Market Go From Here?
You may as well ask a Ouija board. I have been in this business for a very long time, so I have my own opinion and concerns. But the market reflects the logic or illogic, the enthusiasm or dismay, of millions of individuals with their own emotions. As a result, I look for what little certainty I can find to provide ballast for the tough times.
Some difficulties I expect to unfold in the coming months include other nations and their citizens placing less faith in the US dollar. The USD has offered the steadiness of a fair reserve currency for a very long time. If that status is squandered, what happens to US companies that have relied upon that bulwark?
Tariffs that may (or may not, depending on what day it is) be as high as the disastrous Smoot-Hawley tariffs give me pause.
Brokerage firm and other analysts have steadily lowered their expectations for growth. At the beginning of the year, those forecasts for the companies in the S&P 500 hovered around 8%. Those forecasts have now been slashed to around 4%.
Interestingly, that number of 4% is also the nosebleed territory we find ourselves in when viewing the cyclically adjusted PE [CAPE] ratio for the S&P 500. We are now at 96th percentile of the composite’s historic PE ratio for this indicator. The S&P has only been more expensive 4% of the time prior to today.
We could still see a Brave New World where tariffs slip quietly away, the USD regains its role, US firms’ earnings blow right past the reduced expectations, and 30 times earnings becomes the new midpoint standard.
I am not among those who believe this is most likely.
That is why I am moving my and my clients’ funds more to utilities, preferred shares, Europe and other developed nations' multinational firms, precious metals, and managed futures. I will be writing about each of these in turn going forward.
I hope you enjoy the suggestion of FXU for your due diligence. I look forward to your comments.
More By This Author:
September: The Pause That Refreshes
MLPX: The Energy Handwriting Is On The Wall, Buy Infrastructure
Lithium Americas: A Few Bullet Points On The Latest Share Price Debacle
Disclaimer: Unless you are a client of my portfolio management firm, Stanford Wealth Management, I do not know your personal financial situation. Therefore, I offer my opinions above for your ...
more

