
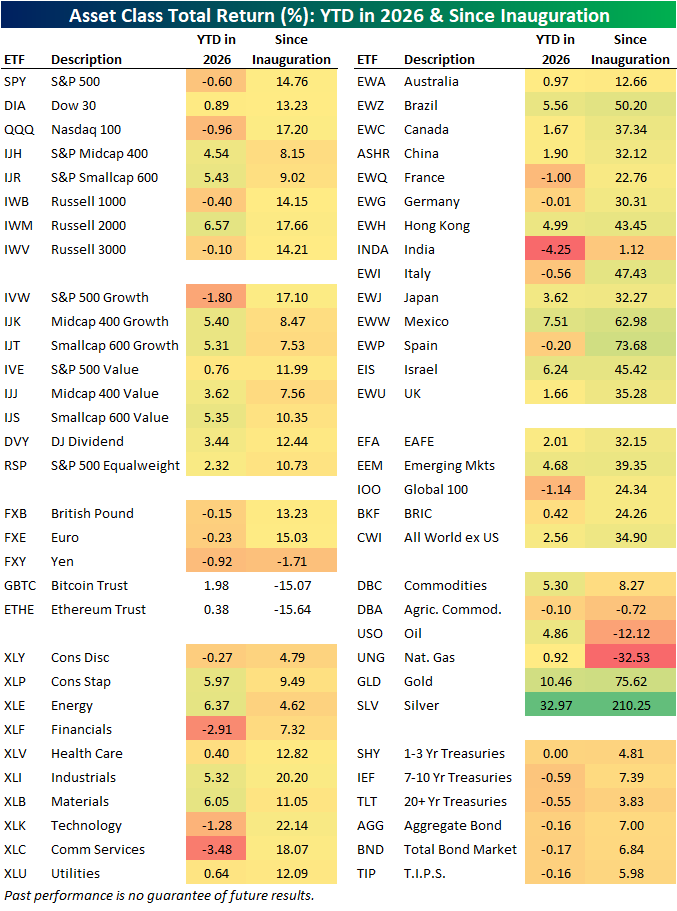
It has been one year since President Trump was sworn in for a second time. Looking back on the past year using our ETF asset class matrix below, the single best performing assets were precious metals with gold (GLD) up 75.6% and silver (SLV) providing an astounding 210.6% total return.
While their gains didn't quite stack up to gold and silver, equities also had a respectable year. The major US indices all provided a total return ranging from high-single digits to the mid-teens with oversized gains from the small-cap Russell 2,000, large cap growth (IVW), and the Nasdaq 100 (QQQ).
On a sector level, traditionally cyclical areas were mixed as the likes of Energy (XLE), Consumer Discretionary (XLY), and Financials (XLF) underperformed with mid-single digit gains whereas Tech (XLK) and Industrials (XLI) both provided total returns surpassing 20%. Closing in on one month into the new year, there has been some rotation as XLE has rebounded while XLK is in the red.
While US equities did well in Trump's first year, it was internationals that were the stars in the equity space. Of the fourteen country ETFs shown in the matrix below, only two underperformed the S&P 500 (SPY). Those were Australia (EWA) with a marginal 2 percentage points of underperformance and more meaningful lagging performance from India (INDA).
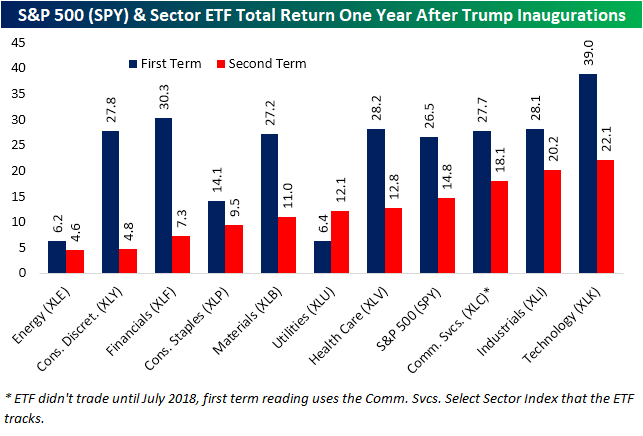
Looking back to the first time Trump was sworn in back in 2017, the year following saw an even larger gain for the S&P 500 ETF (SPY) as it offered a 26.5% return in Trump's first year in the Presidency. For this second term, SPY is again higher but by about ten percentage points less. Taking it a step down, the only sector outperforming during this second term versus the first is Utilities (XLU), which is up 12.1% since last January; that compares to a 6.4% gain after the 2017 inauguration. Finally, we would note that whereas in 2017 there was a significant cluster (seven of the eleven sectors) with similarly-sized gains between 25% and 30%, this time there is a more gradual increase across sectors. With that said, Tech was the top performing sector in both periods, and the margin was much larger during the first term.
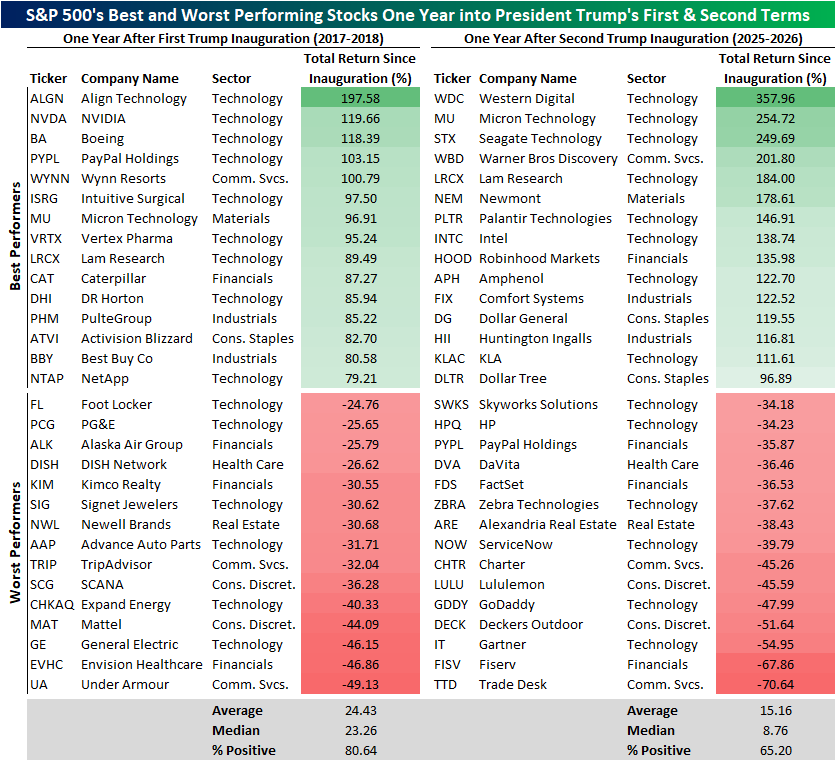
Below we include a look at the S&P 500's individual best and worst stocks of the first year of Trump's first and second terms. As shown, this second term has seen larger losses and larger gains for the best and worst stocks. In fact, of the 15 best performers of the past year, 14 more than doubled compared to only five from 2017 to 2018. Additionally, four stocks were more than cut in half this time around. Only Under Armor (UA) came close to that with a 49% loss after Trump's first inauguration. Despite these big moves at the tail ends of the distribution, on the whole of S&P 500 members, average gains are smaller in the past year than they were from January 2017 to January 2018. Additionally, fewer stocks have risen (80% versus 65%).
(Click on image to enlarge)
More By This Author:
Weird Breadth From Small Businesses
Biggest Risks To The Market?
Trillion Dollar Market Cap Changing Of The Guard


Comments
Log in or sign up to join the conversation.