
Fed’s Singular Focus On Inflation Is Creating Undue Fallout

Image Source: Pexels
April CPI and PPI both reflect continued moderation—albeit as much as the precipitous fall in the Global Supply Chain Pressure Index would suggest (given that supply chains comprise nearly 40% of inflation, according to the New York Fed). The fed funds rate is now officially above both CPI and PCE. Nevertheless, despite hinting in their May FOMC statement that a pause in rate hikes may be imminent, the Fed insists there are no rate cuts in the foreseeable future because inflation remains stubbornly high. But this singular focus on inflation is ignoring all the fallout their hawkishness is causing—which is why investors are not buying it, and instead are pricing in a 99% chance of at least one 25-bp rate cut by year-end and a 17% chance of four cuts (according to CME Group fed funds futures, as of 5/12) while scooping up Treasuries. Regardless, I expect inflation readings to fall substantially over the coming months.
On the good-news front, both investment grade and high yield bond spreads remain tame and in fact, are roughly the same level as they were one year ago. Typically, a rise in credit spreads corresponds to a drop in the S&P 500, and indeed the SPY is roughly unchanged over the past year as well. So, apparently, there is little fear of a “hard landing” or mass defaults on corporate debt. And given the historical 90% correlation between economic growth and corporate profits, the better-than-expected Q1 earnings season is promising. Certainly, juggernaut/bellwether Apple (AAPL) and most of its mega-cap Tech (or near-Tech) cohorts (aka FAANGM) have done their part.
So, this all supports the bull case, right? If inflation remains in a downward trend while earnings are holding up, and investors are so confident in imminent rate cuts, then why are most stocks (other than the aforementioned mega caps) struggling for traction?
Well, it seems there’s always something else to worry about. There is the regional banking crisis (and associated credit crunch) that refuses to go away quietly, thanks to nervous depositors who don’t want to be the last ones left holding the bag. And then there is that pesky debt ceiling standoff, which is easily fixable but also highly politically charged. Amazingly, US credit default swaps are currently priced higher than in emerging markets (including debt graveyards like Mexico, Greece, and Brazil), with potential payouts upwards of 2,500% if the crap hits the fan, according to Bloomberg! Why then are Treasuries simultaneously getting bought up? I think it’s because there’s no doubt about “if” interest will be paid but rather “when,” so they serve as both a value play and a safe haven.
In my view, overly dovish fiscal and monetary policies during the pandemic lockdowns (helicopter money and surging money supply) followed by hawkish policies (rapid increase in interest rates and shrinking of money supply) have been overly disruptive to the both the US and global economies, including a severely inverted yield curve (consistently 50-60 bps on the 10-2 year Treasuries), a banking crisis, and a strong dollar (as a safe haven, despite the recent pullback), which has exported inflation to emerging markets, exacerbating geopolitical turmoil and mass migration (including our border crisis)—not to mention paralysis in the US housing market as homeowners are reluctant to sell and give up their low interest rate mortgages. So, I continue to believe the FOMC has gone too far, too fast in raising rates in its single-minded focus on inflation—which was already destined to fall as supply chains (including manufacturing, transportation, logistics, labor, and energy) gradually recovered.
Moreover, the apparent strength and resilience of the mega-cap-dominated S&P 500 and Nasdaq 100 is a bit of an illusion. While the FAANGM stocks provided strong earnings reports and have performed quite well this year, beneath the surface the story is less inspiring, as illustrated by the relative performance of the equal-weight and small-cap indexes, as I discuss below. From a positive standpoint, fearful investor sentiment is often a contrarian signal, and elevated valuations of the broad market indexes—24.6x forward P/E for the Nasdaq 100 (QQQ) and 18.1x for the S&P 500 (SPY)—suggest that investors expect lower interest rates ahead. However, the high valuations and relatively low equity risk premium (ERP) on those mega-cap-dominated indexes may lead institutional investors to target small and mid-cap stocks as inflation falls and rate cuts arrive, such that market breadth improves.
I believe this enhances the opportunity for skilled active selection and strategic beta indexes that can exploit elevated dispersion among individual stocks. It was money supply (and the resultant asset inflation) that pushed up stock prices. So, if money supply continues to recede, while it will help suppress inflationary pressures, it will be difficult for the mega-cap-driven market indexes to advance—although well-chosen, high-quality individual stocks can still do well.
In this periodic update, I provide a comprehensive market commentary, review Sabrient’s latest fundamentals-based SectorCast quant rankings of the ten U.S. business sectors, and serve up some actionable ETF trading ideas.
Market commentary:
Despite so many distressing issues ranging from geopolitical turmoil and a worsening hot war in Europe to impending global recession, rancorous domestic politics, escalating culture wars, severe weather events, banking crisis, and resulting credit crunch (i.e., contraction in lending), debt ceiling standoff, and myriad other distractions, the Federal Reserve nevertheless has managed to continuously hog the spotlight with its monetary policy decisions, keeping investors on pins-and-needles before each FOMC decision (8 times per year). Chair Powell and his colleagues have been rapidly and ceaselessly jacking rates and talking tough to discourage consumer demand in a single-minded fight to quell inflation. Moreover, Mohamed El-Erian of Allianz believes the contraction in bank lending essentially equates to another 25-50 bps of rate hikes. But the May FOMC statement was the first time Powell has hinted that a pause in hikes may be imminent.
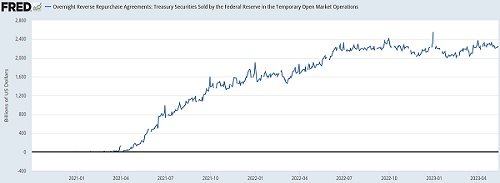
Despite reassurances from experts that the regional banking crisis was contained, it just won’t go away. These banks aren’t struggling due to overleverage, speculation, or mark-to-market requirements that caused past crises. Instead, it’s simply due to the sudden awareness of the sharp asset-liability duration mismatch leading nervous depositors to move their money to perceived safer institutions before everyone else. And increasingly, they are fleeing to institutions that pay higher yields, like money market funds that invest in risk-free/high-yield reverse repurchase agreements (repos)—which pulls capital from the real economy in favor of “playing footsie” with the Fed, thus further exacerbating both the bank run and credit crunch. The reverse repo market has surged from zero to $2.23 trillion in just two years due to the high yields offered by the Fed (risk free), further pulling liquidity from the real economy that might otherwise be loaned to private parties (with some degree of risk).
Many policymakers and commentators expected that the Fed’s implied guarantee of all bank deposits (not just the FDIC limits) would staunch the bleeding, but it might take a more concerted PR campaign imploring depositors to sit tight and conduct business-as-usual with the comfort of an explicit federal backstop.
According to the WSJ, institutions have pulled $334 billion from stocks over the past 12 months, and according to the latest BofA Survey, investment managers now have their lowest allocation to stocks versus bonds since March 2009. Much of the cash is finding its way into the aforementioned money market funds (and reverse repos). Also, the University of Michigan Consumer Confidence Index tumbled to its lowest level since November 2022, which erased over half the gains off its all-time historic low from June 2022. All told concerns are rising that the Fed and our elected officials may induce a deeper recession than originally feared. In addition, history suggests that the stock market doesn’t find a bottom until several months after the first Fed rate cut. On the other hand, all that accumulated cash by institutions and money market funds eventually can serve as fuel for the next bull run in stocks.
Supply chains, inflation, and money supply:
Inflation and jobs reports have been displaying the trends that investors and the Fed hoped to see. The jobs report showed some softening (including downward revisions to the prior month), but not so bad that it would suggest a harsh recession. CPI has continued its descent from 9.1% last June to the April reading of 4.9%, while PPI fell to 2.3% and PCE has softened as well to the March reading of 4.2%—and these metrics are lagging indicators. So, given this and the 12 encouraging signs I discussed in my March blog post, I believe the writing is on the wall for a continued inflation downtrend…and no further rate hikes.
Indeed, the commodity “reflation” we saw in January has greatly subsided, freight rates have fallen back to pre-COVID levels as shipping demand slows, and supply-chain problems have continued to improve dramatically. The Import/Export Price Index survey for April showed a 4.8% YoY drop in import prices and a steep 5.9% drop in export prices. Also worth mentioning, the Gross Output by Industry (GO) price deflator shows price inflation in the supply chain almost coming to an end in Q4 at only +0.5%, after increasing at double-digit percentages a year ago. Of course, the flipside to falling commodity prices is that an industrial commodity like copper is typically an indicator of economic health, but like oil, it has been in a downtrend since its January peak as recession fears have grown.
The New York Fed’s Global Supply Chain Pressure Index (GSCPI), which measures the number of standard deviations from the historical average value (aka Z-score), continues its precipitously fall—from a lofty +4.31 in December 2021 down to a negative April reading of -1.32, which is a level not seen since November 2008 at the depths of the Financial Crisis. Recent improvements have been largely “driven by improvements in Euro Area delivery times.” But in general, there has been softer demand, less shipping congestion, and fewer parts shortages.
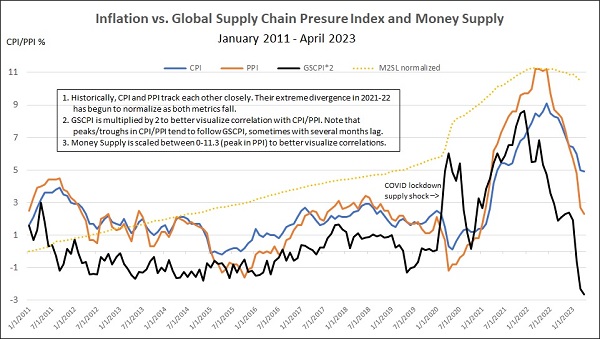
The chart below shows GSCPI plotted against CPI, PPI, and M2 money supply, updated with the latest April data. The peaks and troughs in inflation tend to follow those in GSCPI, sometimes with several months lag. CPI, PPI, and GSCPI all surged when M2SL surged and COVID lockdowns were instituted, and all have fallen precipitously as M2SL has crested. As government stimulus checks and debt and rent forbearance end, the labor participation rate should continue to rise and limit wage inflation. And to close the gaping excess demand gap, aggregate demand simply had to be depressed just enough to buy time for supply chains to gradually mend. I suspect a return to modest money supply growth as supply chains continue to recover will allow continued moderation in inflation, although perhaps not down to the Fed's 2% target anytime soon without inducing a recession (via additional rate hikes and QT).
Besides the bank credit crunch, another issue delaying the recovery of supply chains is an insidious illiquidity created by trapped capital, i.e., money that could be used for other capital projects if freed up. A simple example is a house you’d like to sell or take out a second mortgage or home equity loan on to fund new projects, but you feel you can’t give up the low-rate mortgage you currently hold. So, you do nothing, and economic activity slows.
Another issue delaying the supply chain recovery is the move toward deglobalization due to rising geopolitical tensions, particularly regarding strategic supplies like rare earth metals, semiconductors, and the like, but also to other supply chains. However, I continue to believe we are seeing more of a deconcentration because, outside of new government mandates meant to protect strategic supplies for national security purposes in the event of conflict (especially regarding China—and by extension Taiwan), the free-market economy’s continuous efforts to bring down prices and improve efficiencies will always be a driving force. In addition, many critical supplies are already mined or made in the US, such as the so-called “Battery Belt” from Michigan to Georgia comprising lithium-ion gigafactories for manufacturing, recycling, and refining. One River Digital Asset Management opined, “…globalization is surging despite the fashionable arguments around deglobalization of traded goods. And the areas where globalization is strongest are critical to deepening digital technologies and supporting exponential growth in international connectivity.”
GDP, the debt ceiling, and the Fed:
Economic growth remains positive but not particularly strong. Q4 2022 real GDP according to the BEA’s final estimate was +2.6% (versus +3.2% in Q3 2022), and for Q1 2023, the Atlanta Fed’s respected GDPNow model forecasts +2.7% growth (as of 5/8). ISM Manufacturing Index declined to 46.3 in March, which was below estimates, reflecting contraction. Interestingly, Gross Output by Industry (GO)—which measures spending at all stages of production—grew by only +1.0%. And business (B2B) spending actually declined 5% in real terms in Q4. According to GO creator Mark Skousen, when GO grows at a slower pace than GDP, it suggests a slowdown or recession is in the future.
Unfortunately, our total public debt has grown faster, and at $31.4 trillion we have reached yet another debt ceiling limit. Unfortunately, rather than actually paying its bills out of revenues like most businesses and households, our government just rolls old debt into new debt with ever higher interest payments. The only way out is to grow real GDP faster than the debt is rising, which becomes more difficult as the budget is increasingly allocated to debt service. Today, although total debt is expected to grow about 2 pps per year, according to the CBO, the interest payments portion of the budget keeps rising and is now as large as spending on defense. Furthermore, First Trust pointed out that over the past 90 years, non-defense government spending has grown 10x faster than GDP, and entitlement programs (e.g., Social Security, Medicare, Medicaid) will cost nearly 11% of GDP this year. As Brian Wesbury recently tweeted, “Cutting government spending will boost economic output, jobs, and the stock market. Lifting the debt ceiling and continuing to increase government spending will slow GDP growth and job creation, reduce profits and harm the stock market.”
Eric Peters of One River Asset Management warns, “…for decades our debts have grown faster than economic output. The process is accelerating, and this is unfolding before the avalanche of entitlement commitments hits in earnest…[at some point] global investors will lose faith in the US government’s ability to service this colossal and growing debt with anything other than debased dollars…In a nation unwilling to endure prolonged austerity, the only credible way to push that date into the distant future requires technological advance that generates dramatic productivity gains.”
The way I see it, the world shifted from a 13-year post-Financial Crisis synchronized global accommodation that brought a surge in global debt, to a synchronized global devaluation of major currencies to try to “inflate away” the debt. But inflation is harsh, painful, and destructive. So, instead perhaps the ultimate solution (outside of Peters’ “dramatic productivity gains”) might have to be a synchronized global debt retirement in which the G-20 central banks orchestrate something of a modified monetization/cancelation of most or all sovereign debt, providing a fresh start for all, perhaps with a return to a gold standard for all currencies. Just thinking out loud.
Until then, it appears the days of high real GDP growth rates (in the US and other developed markets) are behind us, given the rising debt-to-GDP ratio, especially in the face of the global push for less fossil fuel use and more government spending on climate-friendly “net zero” energy infrastructure that is inherently more inefficient, unreliable, and expensive (given current technology, at least until today’s more efficient nuclear technology regains traction…or the holy grail also called nuclear fusion becomes commercial, which is becoming more likely). Furthermore, much of the capital investment today is focused on the aforementioned deconcentration and “nearshoring” of manufacturing facilities and mines for national security purposes, which is inflationary (at least in the near-term) given that these resources already exist in lower-cost locations in the globalized economy.
Bond yields and the US dollar have resumed their gradual downtrends (and bitcoin has surged) on expectation that the Fed may have to temper its hawkish policies (and live with somewhat higher inflation than its 2% target) to ensure bank liquidity and a sufficient supply of dollars for global transactions, and to stop exporting inflation via the strong dollar—although yields climbed more recently on worries about the debt ceiling standoff. As for the expected breakeven inflation rates, both the 5-year and the 5-year, 5-year forward rates indicate around 2.2% inflation down the road.
Likewise, in his recent Investment Outlook, “Wall Street Playbill,” bond maven Bill Gross wrote that it will be difficult to return to the 2% inflation target. He thinks it will be necessary to accept higher inflation to maintain growth in the US and global economies—and also for healthy capital markets. So, he says we should expect 3%+ CPI and recommends including TIPS and commodities in a diversified portfolio, plus companies with pricing power to maintain margins, as well as regional banks (as a value play).
MacroStrategy in London believes,
“The Fed is behind the curve and will need to pivot.” Marcel Kasumovich of One River Asset Management wrote, “Every crisis in the past thirty years has been met with lower lows in policy rates and central bank balance sheet expansion when rate cuts weren’t enough…and instability in the banking system can be immediately cured by a sharp decline in bank funding costs—rate cuts.” The conundrum is, “Financial [banks] and price stability [inflation] are competing objectives.”
Notably, when the Fed hiked rates in the early 1980s from around 10% to 20% within 2 years, it was only a 2x increase in financing cost, while today, raising rates from ZIRP (0.25%) to 5.0% in less than 15 months amounts to a 20x increase in a shorter time span! So, you have to look at things in relative rather than absolute terms to understand the full impact of policy changes.
Is it any wonder there is a shortage of supply in the housing market as homeowners are reluctant to sell and give up the low interest rate mortgages they hold? Or that personal savings as a percentage of disposable income is still at historically low levels, while household debt service is increasing rapidly (in both absolute terms and as a percentage of disposable income)?
Earlier this year, as capital flowed out of bonds into cash, 2-year Treasury notes spiked to 5.07% on 3/8. But just three trading days later, the yield fell below 3.8%--i.e., more than 125 bps in just three days, which was the biggest such drop since 1987. The commensurate fall in mortgage rates created a welcome boon for the housing market. Furthermore, falling interest rates provide support not only for bonds but also for equity valuations (on a discounted cash flow basis), as long as earnings hold up. Again, CME Group fed funds futures are currently pricing a 99% chance of at least one 25-bp rate cut from the current level by year-end and a 17% chance of four cuts (as of 5/12).
Market breadth:
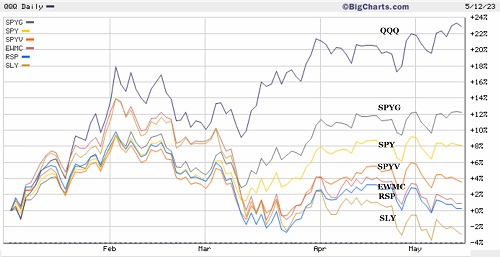
Despite the apparent strength and resilience of the mega-cap-dominated S&P 500 (SPY) and Nasdaq 100 (QQQ), it has been led by the FAANGM family of mega-cap Tech or “near-Tech” stocks. The chart below compares the stellar YTD performance of the QQQ against SPY, S&P 500 Growth (SPYG), S&P 500 Value (SPYV), S&P 400 MidCap Equal Weight (EWMC), S&P 500 Equal Weight (RSP), and S&P 600 Small Cap (SLY). You can see that QQQ has nearly doubled the performance of its closest rival SPYG, and both are growth focused, with value oriented SPYV far behind. Moreover, the equal-weight large and mid-cap indexes, which are not dominated by the mega-caps, are essentially even and barely above the zero line, and the small cap index trails badly. This helps to illustrate just how out of favor the greater population of stocks are.
Value is trailing due to most stocks in this category being from economically sensitive cyclical sectors, like Financials, Energy, Materials, and Industrials, although, notably, Microsoft (MSFT) is a constituent of QQQ, SPY, SPYG, and SPYV. SPYG holds 34% InfoTech and only 7% Financials, while SPYV holds 17% InfoTech and 19% Financials and SLY holds 13% InfoTech and 16% Financials. So, because Financials make up an outsized proportion of Value indexes versus Growth, a substantial recovery in the banking sector would be a boon for the Value indexes.
Notably, most commentators expect small caps to lead the next bull leg up—and that makes sense as the mega caps have been “bought up” due both to their solid earnings reports and their modern status as all-weather defensive plays. But with valuations at 24.6x forward P/E for the Nasdaq 100 (QQQ) and 18.1x for the S&P 500 (SPY), mean reversion would suggest that their smaller brethren will outperform.
Despite continued worries about fallout from the banking crisis, credit crunch, and debt ceiling standoff, investment grade and high yield bond spreads remain tame. Note that a rise in the credit spread typically corresponds to a drop in the S&P 500. Indeed, those credit spreads are roughly the same level they were one year ago, and so is the SPY as well. And so far, the contraction in lending may not be as bad as feared.
For the first time since 2021, earnings growth trends are showing some improvement. Throughout 2022, earnings growth rates kept deteriorating. In Q1 2022, earnings growth was running at +10%. In Q2, it dropped to +7%, +3% in Q3, and then went negative in Q4 2022 at -3.5%. But for Q1 2023, the earnings growth rate has improved a bit to -2.5%. As Q1 reporting season nears the end, most companies in the S&P 500 are beating estimates—and by a wide margin. According to FactSet, average sales are about 2.5% above estimates, and EPS about 6.5% above expectations. Importantly, margins have shown some signs of recovery, at about 11.5%. However, analysts have been cutting estimates for the rest of the year.
Housing, real estate services, and residential REITs all stand to benefit from lower interest rates, rising confidence, and higher risk appetite. Notably, the iShares US Home Construction (ITB) is now scoring strongly in our SectorCast model, as described below. There has been insufficient construction relative to household formations and growing demand, which eventually will need to be met, as opposed to commercial office real estate which still have high vacancy rates.
Oil & gas stocks have pulled back this year on a combination of a technical pullback (after an extraordinary year for the Energy sector last year) and the unusually warm winter depressing demand (especially for natural gas), along with rising supply as production was picked up. However, the International Energy Agency forecasts that the oil market will fall into a 400,000 barrels per day deficit soon, growing to 2 million bpd deficit in H2 2023. Reasons include unexpectedly strong Chinese demand, an OPEC+ production cut, and a reluctance among the larger US firms to substantially boost production. Estimates remain volatile, however. When OPEC+ announced its cut, oil prices spiked above $80 while Energy stocks surged into mid-April. But as oil price pulled back to around $70, share prices have pulled back as well. Both appear to be testing a potential bottom at current levels, and earnings estimates in the Energy sector may soon be revised upwards once again—assuming strengthening of oil prices, a Fed pause or pivot, and/or an improvement in the economic growth forecast.
In anticipation of a Fed pause, Alpine Macro suggests overweighting “early cyclicals,” specifically banks, retailers, homebuilders, transports, and small caps, since these market segments “…do not require economic improvement or better pricing power in their sector to outperform the broad market. All that is needed for outperformance are signs that the odds of monetary easing, and no existential crisis in their sector.” Furthermore, they believe that banks have higher beta and depressed valuations and will benefit from lower bond yields, while insurance companies have lower beta and elevated valuations, as well as lower operating leverage. In my view, the combination of falling yields and mortgage rates along with growing demand is a great setup for the housing market…and the scary headlines about 15-20% further downside in home prices are overblown. Likewise, Morgan Stanley’s Michael Wilson believes some industries like Financials and Retailers have already largely repriced and may now offer investment opportunities.
Final comments:
My expectation is that recovering supply chains (encompassing manufacturing, transportation, logistics, energy, labor) and disinflationary secular trends will continue to provide the restraint on wage and price inflation that the Fed seeks without having to double-down on its intervention/manipulation—and it’s not just due to the sudden banking crisis magnifying fragility in our economy. Regardless, given the historical 90% correlation between economic growth and aggregate corporate profits, the passive broad-market mega-cap-dominated indexes that were so hard for active managers to beat in the past may well continue to see volatility, particularly in the face of slow GDP growth (well below inflation), reduced earnings estimates, elevated valuations, and a low equity risk premium. Nevertheless, I believe many companies—particularly within the stronger sectors—will do quite well.
As the end of the Fed tightening cycle nears, the resilience of our big financial institutions and the responsiveness of regulators should keep financial meltdowns at bay. As banks roll their maturing lower-rate Treasuries into higher-yielding replacements, they will report better earnings. (This is one of the drivers behind Sabrient’s models liking some of the beaten-down regional banks. And when the next recovery begins, the $7 trillion in money market funds represents a sea of liquidity that may fuel the new bull market.
Thus, investors may be better served by strategic-beta and active strategies that can exploit the performance dispersion among individual stocks, which should be favorable for Sabrient’s portfolios—including Small Cap Growth 38, Dividend 43, and the Q2 2023 Baker’s Dozen—all of which combine value, quality, and growth factors while providing exposure to both longer-term secular growth trends and shorter-term cyclical growth and value-based opportunities. Note that Dividend 43 offers both capital appreciation potential and a current yield of 5.4%.
Latest Sector Rankings:
Relative sector rankings are based on our proprietary SectorCast model, which builds a composite profile of each of over 1,000 equity ETFs based on bottom-up aggregate scoring of the constituent stocks. The Outlook Score is a Growth at a Reasonable Price (GARP) model that employs a forward-looking, fundamentals-based multifactor algorithm considering forward valuation, historical and projected earnings growth, the dynamics of Wall Street analysts’ consensus earnings estimates and recent revisions (up or down), quality and sustainability of reported earnings, and various return ratios. It helps us predict relative performance over the next 3-6 months.
In addition, SectorCast computes a Bull Score and Bear Score for each ETF based on recent price behavior of the constituent stocks on particularly strong and weak market days. A high Bull score indicates that stocks within the ETF recently have tended toward relative outperformance when the market is strong, while a high Bear score indicates that stocks within the ETF have tended to hold up relatively well (i.e., safe havens) when the market is weak.
Outlook score is forward-looking while Bull and Bear are backward-looking. As a group, these three scores can be helpful for positioning a portfolio for a given set of anticipated market conditions. Of course, each ETF holds a unique portfolio of stocks and position weights, so the sectors represented will score differently depending upon which set of ETFs is used. We use the iShares that represent the ten major U.S. business sectors: Financials (IYF), Technology (IYW), Industrials (IYJ), Healthcare (IYH), Consumer Staples (IYK), Consumer Discretionary (IYC), Energy (IYE), Basic Materials (IYM), Telecommunications (IYZ), and Utilities (IDU). Whereas the Select Sector SPDRs only contain stocks from the S&P 500 large cap index, I prefer the iShares for their larger universe and broader diversity.
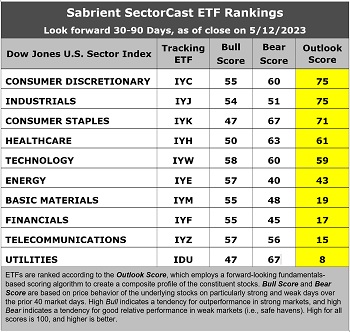
This week’s fundamentals-based Outlook rankings display a slightly bullish bias given that the economically sensitive and cyclical sectors have moved up the rankings. Consumer Discretionary and Industrials sit at the top, despite elevated P/E ratios, on the strength of sell-side analysts’ upward revisions to EPS estimates, solid EPS growth forecasts, and good return ratios. Healthcare, Technology, and Energy are also scoring pretty well. Consumer Discretionary has the second lowest (attractive) forward PEG ratio of 1.18, behind only Financials at 1.04. It is interesting that the four lowest-P/E sectors (Energy, Financials, Telecom, and Basic Materials) all score in the bottom half of the GARP-based Outlook rankings. Defensive sector Consumer Staples scores highly primarily due to having the most analyst upgrades to EPS expectations, but the other defensive sectors Utilities and Telecom are at the bottom. Keep in mind, the Outlook Rank does not include timing, momentum, or relative strength factors, but rather reflects the consensus fundamental expectations at a given point in time for individual stocks, aggregated by sector.
ETF Trading Ideas:
Our Sector Rotation model, which appropriately weights Outlook, Bull, and Bear scores in accordance with the overall market’s prevailing trend (bullish, neutral, or defensive), took a bullish posture when SPY rose above its 50-day simple moving averages in late March. It suggests holding Technology (IYW), Consumer Discretionary (IYC), and Energy (IYE), in that order. (Note: In this model, we consider the bias to be bullish from a rules-based trend-following standpoint when SPY is above both its 50-day and 200-day simple moving averages.)
If you prefer a neutral bias, the Sector Rotation model suggests holding Consumer Discretionary, Industrials (IYJ), and Consumer Staples (IYK). Or, if you prefer a defensive stance given all the macro uncertainties and the overbought technicals, the model suggests holding Consumer Staples, Healthcare (IYH), and Consumer Discretionary, in that order. Note that IYC is suggested for all three scenarios.
An assortment of other interesting ETFs that are scoring well in our latest rankings include: Inspire Fidelis Multi Factor (FDLS), UPHOLDINGS Compound Kings (KNGS), Kelly Hotel & Lodging (BEDZ), Invesco DWA Financial Momentum (PFI), AdvisorShares Alpha DNA Equity Sentiment (SENT), Invesco Dynamic Networking (PXQ), Invesco DWA Technology Momentum (PTF), US Global Jets (JETS), iShares US Home Construction (ITB), ETC 6 Meridian Quality Growth (SXQG), Defiance Hotel, Airline, and Cruise (CRUZ), ALPS Global Travel Beneficiaries (JRNY), JPMorgan Social Advancement (UPWD), SEI Enhanced US Large Cap Quality Factor (SEIQ), Invesco Dynamic Building & Construction (PKB), Wisdom Tree Growth Leaders (PLAT), Putnam BDC Income (PBDC), ETFMG Prime Mobile Payments (IPAY), Pinnacle Focused Opportunities (FCUS), Invesco DWA Industrials Momentum (PRN), QRAFT AI-Enhanced US Large Cap Momentum (AMOM), Sterling Capital Focus Equity (LCG), and Donoghue Forlines Risk Managed Innovation (DFNV). All score in the top decile (90-100) of Outlook scores.
More By This Author:
Stocks Flounder Despite Inflation Downtrend As Banking Crisis Emerges, But Outlook Remains Encouraging
Uncertainties On Fed Policy, Geopolitics, And Earnings Cloud 2023 Outlook, But Trends Are Promising
The S&P's Roller Coaster Rally
Disclaimer: Opinions expressed are the author’s alone and do not necessarily reflect the views of Sabrient. This newsletter is published solely for informational purposes and is not to be ...
more

