
The year began with the market showing resilience in the face of the Fed’s rate hikes, balance sheet contraction, hawkish rhetoric, and willingness to inflict further economic pain, including a recession and rising unemployment (if that’s what it takes). Of course, we also had a treacherous geopolitical landscape of escalating aggression by Russia in Ukraine, by China (regarding both Ukraine and Taiwan), and North Korea (persistent rocket launches and saber-rattling). But really, the direction for stocks came down to the trend in inflation and the Fed’s response—and the latest readings on CPI and especially PPI are quite encouraging. But alas, it now appears it isn’t quite that simple, as we have a burgeoning banking crisis to throw another monkey wrench into the mix. As Roseanne Roseannadanna used to say in the early Saturday Night Live sketches, "It just goes to show you, it's always something—if it ain't one thing, it's another."
I warned in my January post that 1H 2023 would be volatile as investors searched for clarity amid a fog of macro uncertainties. And I often opine that the Fed can’t rapidly raise rates on a heavily leveraged economy—which was incentivized by ZIRP and massive money supply growth to speculate for higher returns—without fallout (aka “breaking something”). Besides impacts like exporting inflation and societal turmoil to our trading partners, the rapid pace of rate hikes has quickly lowered the value of bank reserves (as bond prices fell). Last week this in turn led to massive portfolio losses and a federal takeover for SVB Financial (SIVB) which caters to California’s start-up and technology community, as it was pushed into selling reserves to meet an onslaught of customer withdrawals. The normally stable 2-year T-Note spiked, crashing its yield by over 100 bps in just a few days. Other regional banks have required rescue or support as well, including stalwarts like Signature Bank (SBNY) and First Republic (FRC)…and then scandal-prone European behemoth Credit Suisse (CS) revealed “material weaknesses” in its accounting…and Moody’s cut its outlook on US banks from stable to negative. So, something indeed broke in the financial system.
Fortunately, inflation fears were somewhat assuaged this week, as all reports showed trends that the Fed (and investors) hoped to see. February CPI registered 6.0%, which is the lowest reading since September 2021. Despite the historical observation that a CPI above 5% has never come back down to a desirable level without the fed funds rate exceeding CPI, we already have seen CPI fall substantially from 9.1% last June without fed funds even cracking the 5% handle, much less 6%—and CPI is a lagging indicator. So, given the 12 encouraging signs I describe in my full post below, I believe the writing is on the wall, so to speak, for a continued inflation downtrend.
So, the question is, will the Fed feel it must follow through on its hawkish inflation-busting jawboning at the FOMC meeting next week to force the economy into recession? Or will recovering supply chains (including manufacturing, transportation, logistics, energy, labor) and disinflationary secular trends continue to provide the restraint on wage and price inflation that the Fed seeks without having to double down on its intervention/manipulation?
My expectation is the latter—and it’s not just due to the sudden banking crisis magnifying fragility in our economy. Nothing goes in a straight line for long, and inflation is no different, i.e., the path is volatile, but disinflationary trends remain intact. I talk more about this in my full post below. Regardless, given the anemic GDP growth forecast (well below inflation) and the historical 90% correlation between economic growth and aggregate corporate profits, the passive broad-market mega-cap-dominated indexes that have been so hard for active managers to beat in the past may well continue to see volatility.
Nevertheless, many individual companies—particularly within the stronger sectors—could still do well. Thus, investors may be better served by pursuing equal-weight and strategic-beta ETFs as well as active strategies that can exploit the performance dispersion among individual stocks—which should be favorable for Sabrient’s portfolios, including the newest Q1 2023 Baker’s Dozen, Small Cap Growth 37, and Dividend 43 (offering both capital appreciation potential and a current yield of 5.2%), all of which combine value, quality, and growth factors while providing exposure to both longer-term secular growth trends and shorter-term cyclical growth opportunities.
Quick plug for Sabrient’s newest product, a stock and ETF screening and scoring tool called SmartSheets, which comprise two simple downloadable spreadsheets that provide access to 9 of our proprietary quant scores. Prior to the sudden fall of SIVB, on a scale of 0-100 with 100 the “best,” our rankings showed SIVB carried a low score in our proprietary Earnings Quality Rank of 35, a GARP (growth at a reasonable price) score of 37, and a BEAR score (relative performance in weak market conditions) of 13. Also worth mentioning, Lantheus Holdings (LNTH) was consistently ranked our #1 GARP stock for the first several months of the year before it knocked its earnings report out of the park on 2/23 and shot up over +20% in one day. (Note: you can find our full Baker’s Dozen performance details here.) Feel free to download the latest weekly sheets using the link above—free of charge for now—and please send us your feedback!
Here is a link to a printable version of this post. In this periodic update, I provide a comprehensive market commentary, offer my technical analysis of the S&P 500 chart, review Sabrient’s latest fundamentals-based SectorCast quant rankings of the ten U.S. business sectors, and serve up some actionable ETF trading ideas. To summarize, our SectorCast rankings reflect a slightly bullish-to-neutral bias, the technical picture looks short-term oversold, and our sector rotation model has taken a defensive posture. Technology has taken over the top position in our sector rankings.
Market commentary:
I was going to post this commentary last week but decided to wait until after the jobs, CPI, and PPI reports for February came out. Indeed, fears that inflation’s downtrend had stalled out in January appears to have turned out to be normal seasonal volatility. That would have been enough to send markets on a new upward trajectory if not for the sudden banking crisis. Of course, the turmoil is caused by a combination of: 1) rapidly rising interest rates lowering the value of bonds held as mandatory bank reserves (estimated at over $600 billion in unrealized losses), 2) stress tests designed to fight the 2008 problems with loan losses do not help with today’s problem of diminished value of reserves, 3) failure by bank management to sufficiently hedge interest rate risk, and 4) panic-induced run on the banks by fearful depositors. The sad truth is that there would be no crisis if depositors simply went about their normal routines and didn’t rush to drain their deposits. As rates retreat, bank reserves will eventually regain their value. But instead, suddenly we are all Venezuela. (I have been recommending staying long in high quality companies but hedged—and my personal hedges in gold, crypto, and leveraged bond and inverse stock market ETFs have softened the blow in my own portfolio.)
The optimism that drove the January surge in both stocks and bonds (and pushed down yields) subsided in February due to the resilience of the global economy and labor markets (in a “good news is bad news” scenario) and the apparent stall in inflation’s downtrend (according to the January CPI, PPI, and PCE reports), which led the Fed to reassert that rates may stay “higher for longer” to more forcefully depress excess consumer demand, inflationary pressures, and jobs growth. Moreover, the “higher for longer” theme for inflation, nominal interest rates, and (importantly) real yields (as nominal yields have risen while inflation expectations fall) threatened corporate margins, earnings, and stock valuations. Indeed, Wall Street analysts expect S&P profit growth to be negative year over year in Q1, and revenue growth will likely lag inflation. In addition, the unemployment rate has remained stubbornly low as employers deal with falling productivity, low labor force participation, and difficulty in finding experienced workers when they are needed.
All of this suggested to investors that bonds will remain competitive with stocks such that the longstanding TINA ("There is no alternative”) acronym for stocks is no longer true. So, while it has been evident that this market is itching to rally if only the Fed would get out of the way, Fed rhetoric has remained laser-focused on a 2% inflation target—which is looking overly restrictive on the economy and spooking investors. Sentiment abruptly shifted from excitement to fear that a highly anticipated Fed pause and dovish pivot in monetary policy are still a ways off and that the Fed instead will have to follow through on its hawkish rhetoric, leading to February’s spike in yields, resurgence in the US dollar, and high stock-bond correlation with 100% retracement of the January bond rally and 50% retracement of the S&P 500’s January rally.
Then the first half of March (ahead of the February jobs, CPI, and PPI reports) displayed a stock-bond divergence, with stocks falling hard while bond prices surged (as yields sunk) in a defensive rotation to safety. The CBOE Volatility Index (VIX) spiked to the 30 “panic threshold” in the wake of the sudden regional bank liquidity crisis. But then the highly anticipated inflation reports were released showing +6.0% YoY CPI print for February (down from +6.4% for January) and +4.6% YoY PPI (down from +5.7% for January). Goldman Sachs economists still expect core PCE (the Fed’s preferred gauge of inflation) to decline to about 3% by December of this year, reflecting weaker commodity prices, improving supply chains, falling shelter inflation, and slowing wage growth.
Inflation, money supply, and Fed policy:
Again, February CPI came in at 6.0%, with the main driver being housing rents, which accounted for over half the MoM increase. As for the February jobs report, new jobs came in a bit higher than expectations but were concentrated in a handful of services industries while unemployment and labor participation both rose by a tick and wage growth slowed, which I’m sure the Fed liked seeing. Moreover, the ADP private payrolls report on the previous day showed a much lower number, which calls into question the Labor Department’s report. Retail sales fell modestly in February (and were up +5.4% YoY), although “core” retail sales rose, so it was a mixed bag. Manufacturing indices are in contraction territory as consumers have shifted purchases from goods to services (with the ISM Manufacturing Index at 47.7 in February while ISM Non-Manufacturing Index came in at a solid 55.1).
I have long opined that the Fed was simply trying to “talk up” interest rates without having to actually raise them so much—so that they wouldn’t have to quickly reverse those rate hikes when the economy faltered. But investors were not buying it in January, and in fact seemed to embrace the ongoing chaos and the Fed’s determination to cause a recession because they were assuming it would lead to a dovish pivot. This forced the Fed to carry through on its threats—even doubling down on them—leading investors to sell bonds in expectation of even higher rates. This made the entire yield curve rise while increasing its inversion (to more than 100 bps at one point on the 2-10 spread, which is the worst in more than 40 years when the inversion hit 241 bps) suggesting that the bond market sees Fed policy as too tight. I expect yields to moderate and the yield curve to normalize as inflation resumes its downtrend and the Fed pauses rate hikes, which may hold the 10-year yield consistently below 3.5% by summer—although it still might remain inverted until recession fears abate. As of 3/15, following the scary banking developments, the 2-10 inversion had shrunk to 43 bps.
Notably, MacroStrategy in London has opined that, although real rates may seem low versus CPI, in fact, they are “very high” when viewed “against trend” after accounting for “imbalances in the system.” Thus, the Fed “must set policy around the potential growth rate, which has been declining for decades. When viewed in this context, interest rates are clearly too high. The Fed is behind the curve and will need to pivot.”
So, the ducks were lining up pretty well. But then last weekend, with depositors creating a run on certain regional banks, the Fed responded by announcing a full bailout of all depositors, the creation of an emergency lending fund for other at-risk banks, and the promise to ensure stability of the banking system. Such dovish signals led the markets into a collective sigh of relief. Although necessary to preserve market stability, it can’t be ignored that this action further incentivizes investor speculation to earn higher deposit rates by taking the “risk” part out of the idea of risk/reward ratio. It is part of a broader trend in which major market risk has been transferred from the private sector to the public sector. But I digress.
Looking ahead, besides the softer CPI/PPI prints this week and the I see the following 12 encouraging signs:
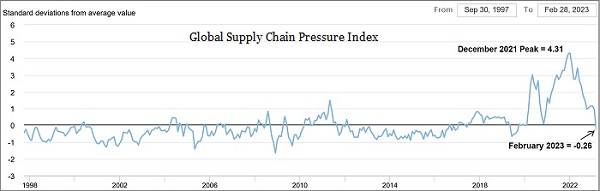
- The New York Fed’s Global Supply Chain Pressure Index (GSCPI) has fallen from a lofty 4.31 in December 2021 to negative territory today (as discussed below).
- Commodity “reflation” in January subsided substantially in February.
- CPI/PPI prints this week indicate that inflation remains in a gradual downtrend as supply and demand return to a better balance.
- The FDIC, Treasury Department, and Federal Reserve have moved quickly to shore up or take over troubled banks and prevent such runs on other banks.
- Labor force participation may be starting to rise as pandemic-era supplemental income programs and debt forbearance end.
- The macro picture has become more favorable, with China rapidly coming back online from its COVID lockdowns (with low inflation) and recession odds in the US falling to something many think could be a “no landing” scenario (as opposed to a soft or hard landing).
- Investment grade and high yield spreads spiked over the past week but still remain at the upper end of a “normal” range, which suggests the corporate market does not anticipate more than a mild recession…nor a widespread banking crisis.
- While earnings estimates have pulled back a bit, capex, dividend increases, and share buybacks all have been strong.
- The VIX has turned back twice this week from strong resistance at the 30 “panic threshold,” which is a contrarian sign to increase equity exposure.
- Equity Risk Premium (ERP) is about 3.9% (inverse of 17.2x S&P 500 forward P/E implies 5.8% earnings yield plus 1.6% dividend yield equals 7.4% versus 10-year yield of around 3.5%) means that valuations can growth in line with earnings growth plus some multiple expansion (to perhaps 18x), once the Fed pauses.
- Although, the technical charts suffered damage last week, and the S&P 500 lost support at its 200-day moving average, the tech/growth-oriented Nasdaq 100 has outperformed and quickly climbed back above its 200-day moving average.
- DataTrek has observed that every economic downturn since 1973 (outside of the self-induced pandemic lockdown) “…has occurred when oil prices rose by 90% or more over a year…As long as oil prices remain at similar levels to today, the odds of recession are lower than widely appreciated.”
Regarding current valuations of US stocks, historically there is a 90% correlation between economic growth and corporate profits. Wall street analyst consensus estimates have fallen a bit, but are generally holding up pretty well, while economic growth is still expected to be positive. Q4 2022 real GDP according to the BEA’s second estimate was +2.7% (versus +3.2% in Q3 2022), and for Q1 2023, the Atlanta Fed’s respected GDPNow model is currently (as of 3/16) forecasting +3.2% growth.
As I have discussed a lot in the past, studies have shown that supply chains account for nearly 40% of inflation, and even the Fed governors acknowledge that rate hikes can’t fix supply chain challenges, ease oil prices, resolve wars, or mitigate the effects of pandemic lockdowns—nor will a self-induced recession, which would impact workers and small businesses the most. As government stimulus checks and debt and rent forbearance end, the labor participation rate should rise and help limit wage inflation. And to close the gaping excess demand gap, aggregate demand simply had to be depressed just enough to buy time for supply chains to gradually mend. Indeed, commodity “reflation” in January subsided in February, and the New York Fed’s Global Supply Chain Pressure Index (GSCPI), which measures the number of standard deviations from the historical average value (aka Z-score), continues to fall precipitously, as shown in the chart below, from a December 2021 high of +4.31 to a negative February reading of -0.26. Note that for most large data sets of any kind, it is rare to see a Z-score fall outside the range of -3 to +3, so the December 2021 high reflected unusually extreme pressures on supply chains, which have rapidly receded.
Disinflationary drivers include:
- Mending supply chains (albeit hindered by escalating war in Ukraine)
- Stable or falling energy, commodity, transportation, and labor costs
- Rising labor force participation, as the end to pandemic-era handouts and debt forbearance force workers back into the job market
- The Fed’s efforts to restrain demand by controlling money supply growth and keeping rates elevated (but not raising them any further, in my view)
- Productivity-enhancing technological innovation/disruption, which supports resilient economic growth
In addition, much like the fear of Y2K catastrophe that never materialized, I think fears of de-globalization outweigh reality. Although we are enduring (and paying for) the impacts of war in Europe and saber-rattling in Asia, onshoring and other current forms of de-globalization are really just some strategic restructuring or “de-concentration” of manufacturing (especially away from China and Taiwan) and “nearshoring” closer to end markets, which reduces uncertainties and cost fluctuations of transportation and logistics. Indeed, some of the major manufacturers in Asia are building factories and production not just in the US but also in Mexico, where the “Made in Mexico” label can benefit from North America’s USMCA trade agreement. As the Cato Institute observed after examining 2022 U.S. trade data from the Census Bureau, “…the much‐ballyhooed Death of Globalization has been greatly exaggerated. In fact, inflation‐adjusted U.S. trade in goods—imports and exports—set records last year.”
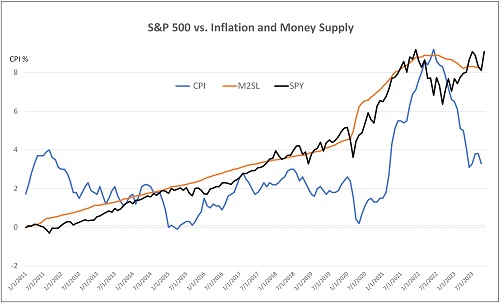
The chart below shows the relationship between the S&P 500, inflation, and M2 money supply since the March 2009 market bottom during the Financial Crisis. You can see the close correlation between rising money supply and rising equity prices (aka asset inflation), while CPI inflation oscillated in a trading range (0-4%). Then, when money supply surged in response to the pandemic lockdowns and stocks quickly raced to catch up, inflation soon followed suit and surged as well. You can see that stocks peaked right around the same time money supply peaked, and then inflation peaked a few months later. However, it was money supply (and the resultant asset inflation) that pushed up stock prices. So, if money supply continues to recede, while it will help suppress inflationary pressures, it will be difficult for the mega-cap-driven market indexes to advance—although well-chosen, high-quality individual stocks can still do well.
The next chart below illustrates the spike/crash in money supply’s nominal growth rate from +26.7% in February 2021 to today’s -1.73%—and its current level is even more deeply negative when you look at the real (net-of-inflation) growth rate.
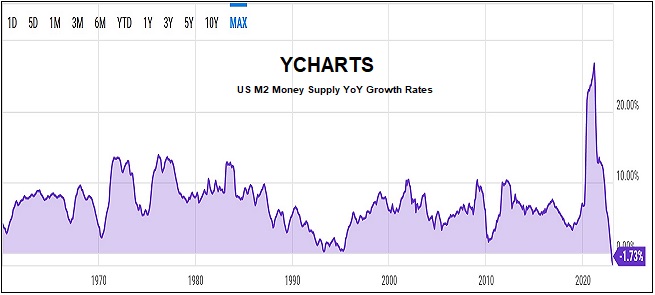
Money supply exploded in 2020-21 but peaked in early 2022 and has since declined at the fastest pace since the 1930’s. According to BofA, the world’s 4 largest central banks have collectively shrunk their balance sheets by $3.1 trillion over the past seven months. Making matters even harder on the Fed’s attempt to reduce money supply are the massive spending bills from Washington, including President Biden’s latest tax-and-spend budget proposal. Besides our need for freshly printed dollars here at home, the Fed also must ensure a sufficient supply of dollars in a global economy that depends upon them—given that 85% of foreign exchange transactions, 60% of foreign exchange reserves, and 50% of cross-border loans and international debt are in US dollars.
With US public debt already gigantic at about 98% of our $32 trillion GDP, the Congressional Budget Office (CBO) projects US public debt will exceed GDP in 2024 and continue to grow from there, hitting 118% in the next 10 years (2033). Furthermore, the CBO projects a federal budget deficit of $1.4 trillion this year (5.3% of GDP), rising to $2.7 trillion (6.9% of GDP) in 2033. Note that with public debt around $31.5 trillion and climbing, every 25-bp rate hike means an extra $78.75 billion/yr in debt service.
Notably, the big increases in nominal GDP we have seen despite lackluster underlying real growth actually makes the debt-to-GDP ratio fall—even though we are running massive budget deficits. Nevertheless, the economic impacts of rising debt levels surely will lead to lower rates ahead. For now, in the wake of the sudden developments in the banking industry, CME Group fed funds futures have been quickly moving all over the board. But as of the morning of 3/16, they show roughly 80% odds of a 25-bp rate hike next week or no hike at all (50 bps is not on the board at all).
Final comments:
As I said at the outset, this market has been itching to rally if only the Fed would get out of the way. But instead, the Fed behaves like most of our government, which seems to want to heavily insert itself in every aspect of our lives. (In fact, the only places our government seems willing to stand aside these days are the US/Mexico border, Antifa riots, and drag shows for kids…but I digress.) Now with a burgeoning banking crisis, it has no choice but to insert itself in concert with the FDIC and US Treasury. But if we can get past this new crisis without much more damage (and the big fall in bond yields this week has certainly helped the cause by boosting the market value of bank reserves), perhaps the market indeed will be set to rally.
Side note: It can be so frustrating when we huddled masses must sit helplessly on pins and needles waiting to see what our government overlords will do next to affect our lives, through spending, regulation, monetary policy…or “temporary” restrictions on our basic freedoms and constitutional rights. Regarding the Fed specifically, will the latest economic reports show that we consumers are “behaving properly,” i.e., reducing our consumption as directed to help bring down inflation? If not, we might be punished with more soul-crushing interest rates—and further job losses. Remember, we got into this inflationary situation and banking crisis through government-induced supply chain disruptions due to overreaction to the pandemic via mass lockdowns, followed by government-provided helicopter money and a massive surge in money supply to pay for it all and keep demand steady, which created a huge supply/demand imbalance and a surge in inflation, leading to government-dictated interest rate hikes that radically inverted the yield curve and suppressed the value of bank reserves leading to a burgeoning banking crisis. It’s like doctor who keeps prescribing new drugs to offset the side-effects of the previously prescribed drugs—the interference of ironfisted and politically driven government control never ends.
As the Fed’s quantitative tightening has worked its way through the economy, rising real yields have depressed demand and boosted savings, while reducing inflation. Reduced consumer demand and a Fed-induced recession will challenge corporate earnings. The inverted yield curve and falling bond prices have already stressed regional banks (due to massive booked losses when they are forced to sell to meet a withdrawal run). So, I believe interest rates will pull back but will likely remain elevated (even if hikes are paused or ended) unless we enter a deep recession and/or inflation falls off a cliff. But somewhat elevated rates are not a bad thing, as fixed income investors deserve a reasonable return on safe Treasuries—which they did not enjoy under ZIRP.
The main determinants of interest rates are inflation, economic growth, and wage growth. Despite the Fed’s hawkish tone, no one either elected or unelected in our government truly wants to crush the “little guy” with a severe recession. In addition, a hawkish Fed creates a strong dollar, which effectively exports inflation to our trading partners, which hurts emerging market economies the most, contributing to the political turmoil and mass migration we are seeing today. So, longer term, I believe the Fed not only will be willing to live with inflation above its 2% goal, but it may become an intentional tactic within a coordinated global monetary policy that seeks to weaken the dollar and gradually “inflate away” the massive dollar-denominated debt loads across the world. As Eric Peters of One River Asset Management wrote, “…practically speaking, our policy makers now find themselves with the tools to solve one set of problems, while simultaneously amplifying others; they can thus avert shorter-term financial instability or longer-term inflation, but not both.”
In fact, elevated inflation and a weaker dollar help reduce deficits. So, to keep the dollar from restrengthening, the Fed may have no choice but to ease up on its restrictive inflation focus, pause on rate hikes, and start printing more dollars (and perhaps even buy foreign sovereign debt) in order to weaken the US dollar and bolster other major currencies. I believe this is why the Fed has been relying so much on tough talk while avoiding talking about M2 money supply—so that it won’t have to reduce its balance sheet so much…nor raise rates so much that it soon must turn around and slash them.
I think inflation and bond yields will continue to recede and supply chains will continue to recover (albeit hindered by Russia’s war)…and the Fed will soon pause. It is possible that bonds may outperform the broad stock market indexes this year as global investors seek their elevated yields and safety, but I still think a portfolio of actively selected, high quality stocks can greatly outperform both the stock and bond indexes. However, keep in mind that equities rely not only on falling rates (from a discounted cash flow basis) but also on growth in both corporate earnings and the equity risk premium, which would be difficult to achieve if we endure a recession with its attendant valuation compression. A good metric to watch for a pulse on the markets is the high yield bond spread, found here.
SPY Chart Review:
The SPDR S&P 500 Trust (SPY) closed Wednesday 3/15 just below 390. It had recently survived two tests of support at its 200-day simple moving average, but alas the banking fiasco sent it crashing through. It came quite close to a retest of December support around 380 before recovering some ground. SPY remains oversold on its oscillators RSI, MACD, and Slow Stochastics. If you pull up a similar chart of the Invesco QQQ Trust Nasdaq 100 (QQQ), it looks much healthier, largely due to its dearth of banks. Tech/growth may well provide market leadership out of this sudden new uncertainty.
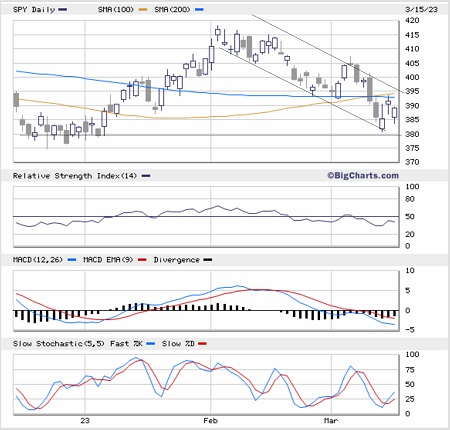
Also worth mentioning, “net new highs” (the daily difference between new 52-week highs and lows) has served as a reliable breadth indicator of impending market strength or weakness. Until recently, while the S&P 500 has remained below its 52-week high, net new highs has been mostly in positive territory this year, indicating a bullish bias. However, the banking crisis has sent the net new highs metric plummeting. Hopefully, it’s only a temporary kneejerk reaction.
Latest Sector Rankings:
Relative sector rankings are based on our proprietary SectorCast model, which builds a composite profile of each of over 1,000 equity ETFs based on bottom-up aggregate scoring of the constituent stocks. The Outlook Score employs a forward-looking, fundamentals-based multifactor algorithm considering forward valuation, historical and projected earnings growth, the dynamics of Wall Street analysts’ consensus earnings estimates and recent revisions (up or down), quality and sustainability of reported earnings, and various return ratios. It helps us predict relative performance over the next 3-6 months.
In addition, SectorCast computes a Bull Score and Bear Score for each ETF based on recent price behavior of the constituent stocks on particularly strong and weak market days. A high Bull score indicates that stocks within the ETF recently have tended toward relative outperformance when the market is strong, while a high Bear score indicates that stocks within the ETF have tended to hold up relatively well (i.e., safe havens) when the market is weak.
Outlook score is forward-looking while Bull and Bear are backward-looking. As a group, these three scores can be helpful for positioning a portfolio for a given set of anticipated market conditions. Of course, each ETF holds a unique portfolio of stocks and position weights, so the sectors represented will score differently depending upon which set of ETFs is used. We use the iShares that represent the ten major U.S. business sectors: Financials (IYF), Technology (IYW), Industrials (IYJ), Healthcare (IYH), Consumer Staples (IYK), Consumer Discretionary (IYC), Energy (IYE), Basic Materials (IYM), Telecommunications (IYZ), and Utilities (IDU). Whereas the Select Sector SPDRs only contain stocks from the S&P 500 large cap index, I prefer the iShares for their larger universe and broader diversity.
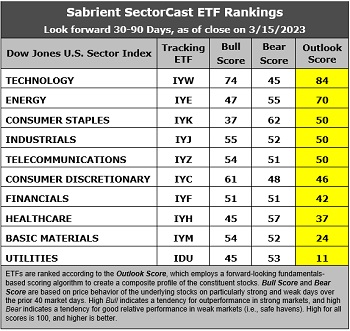
This week’s fundamentals-based Outlook rankings display a slightly bullish-to-neutral bias given that defensive, economically sensitive, cyclical, and “all weather” are ranked all over the map. The high scores for economically sensitive Technology and Energy are offset by low scores for Financials and Materials, while Consumer Discretionary and Industrials sit right in the middle along with defensive Consumer Staples and Telecom. At the same time, the high score for defensive Consumer Staples is offset by the low scores for Utilities and Telecom, and ultra-defensive Utilities is at the bottom. Keep in mind, the Outlook Rank does not include timing, momentum, or relative strength factors, but rather reflects the consensus fundamental expectations at a given point in time for individual stocks, aggregated by sector.
ETF Trading Ideas:
Our Sector Rotation model, which appropriately weights Outlook, Bull, and Bear scores in accordance with the overall market’s prevailing trend (bullish, neutral, or defensive), has taken a defensive posture given the banking crisis. This suggests holding Consumer Staples (IYK), Energy (IYE), and Healthcare (IYH), in that order. (Note: In this model, we consider the bias to be defensive from a rules-based trend-following standpoint when SPY is below both its 50-day and 200-day simple moving averages.)
If you prefer a neutral bias, the Sector Rotation model suggests holding Technology (IYW), Energy, and Consumer Staples. Or, if you are more aggressively pursuing a bullish stance, the model suggests holding Technology, Consumer Discretionary (IYC), and Industrials (IYJ), in that order.
An assortment of other interesting ETFs that are scoring well in our latest rankings include: AdvisorShares Hotel (BEDZ), Simplify Volt Cloud and Cybersecurity Disruption (VCLO), Kelly Hotel & Lodging Sector (HOTL), AdvisorShares Alpha DNA Equity Sentiment (SENT), Invesco Dynamic Networking (PXQ), Invesco DWA Technology Momentum (PTF), First Trust Expanded Technology (XPND), Invesco Select Growth (IVSG), Nuveen Growth Opportunities (NUGO), Putnam BDC Income (PBDC), Innovator IBD 50 (FFTY), Nuveen Winslow Large-Cap Growth ESG (NWLG), Engine No. 1 Transform Climate (NETZ), Inspire Fidelis Multi Factor (FDLS), WBI BullBear Quality 3000 (WBIL), Pacer US Large Cap Cash Cows Growth Leaders (COWG), iShares Global Tech (IXN), Invesco DWA Energy Momentum (PXI), SEI Enhanced US Large Cap Quality Factor (SEIQ), PGIM Jennison Focused Growth (PJFG), Franklin Intelligent Machines (IQM), Fount Metaverse (MTVR), Inspire Faithward Mid Cap Momentum (GLRY), and SPDR S&P Oil & Gas Exploration & Production (XOP). All score in the top decile (90-100) of Outlook scores.
I think another industry to watch is homebuilding, particularly iShares US Home Construction (ITB). Although the forward estimates don’t currently allow it to score well in our SectorCast model (Outlook score of 60), there has been insufficient construction relative to growing demand, which will eventually need to be met.
More By This Author:
Uncertainties On Fed Policy, Geopolitics, And Earnings Cloud 2023 Outlook, But Trends Are Promising
The S&P's Roller Coaster Rally
Signs That Inflation May Be Waning
Comments
Log in or sign up to join the conversation.