The S&P's Roller Coaster Rally
Image Source: Unsplash
The S&P 500 rallied hard from the mid-June 52-week low (3,637) to the mid-August high (4,325), and then it retraced about 50% of that rally in response to Fed chair Powell’s extremely hawkish summer rhetoric. But because he added that the FOMC would react to inflation data as it comes, investors launched a speculative rally into the 9/13 CPI print. “Bad news is good news” became the prevailing mindset as a mild, Fed-induced recession might hasten a reduction in inflationary pressures, leading to a dovish/neutral pivot. But the mildly disappointing August CPI print sent the market reeling, followed by dire warnings from the likes of FedEx and Ford about a weak global economy, such that bad news was suddenly treated as, well, bad news. After an essentially monotonic fall,
the index came quite close on Friday to hitting its June low of 3,637—which means the entire summer rally has officially evaporated.
Some prominent commentators now are calling for an additional selloff, perhaps to as low as 3,000 on the S&P 500 (primarily to rationalize the P/E multiple versus rising interest rates, i.e., the equity risk premium). Goldman Sachs just cut its year-end target from 4,300 to 3,600 (-16%!). And yet the selling was mostly orderly, as the VIX remained below the 30 handle “panic threshold”— which unfortunately led many investors to believe we still have not seen market capitulation and a tradable bottom. But then last Friday featured “all boats sunk” action, and the VIX briefly spiked above 32 before closing right at 30. Nevertheless, the day finished with a solid short-covering rally to end the week.
Although the historic divergences in Growth over Value factor and Large over Small caps have shown convergence over the past couple of years, this year has brought about an historic disconnect in the traditional relationship between equities and Treasuries. Whereas these two asset classes historically have been inversely correlated during volatile times (thus giving value to the traditional 60/40 allocation), this year they have fallen in concert to an extent that hasn’t been witnessed in over 60 years—and Treasury bonds are having their worst year ever. Thus, bonds have not served as a traditional safe haven, although dividend-paying equities (aka “bond proxies”) have held up relatively well this year. The chart below compares the performance of iShares 20+ Year Treasury Bond ETF (TLT) versus vs. iShares Select Dividend ETF (DVY), SPDR S&P 500 ETF (SPY), Real Estate Select Sector SPDR (XLRE), Invesco DB US Dollar Index Bullish Fund (UUP), and SPDR Gold Shares (GLD).
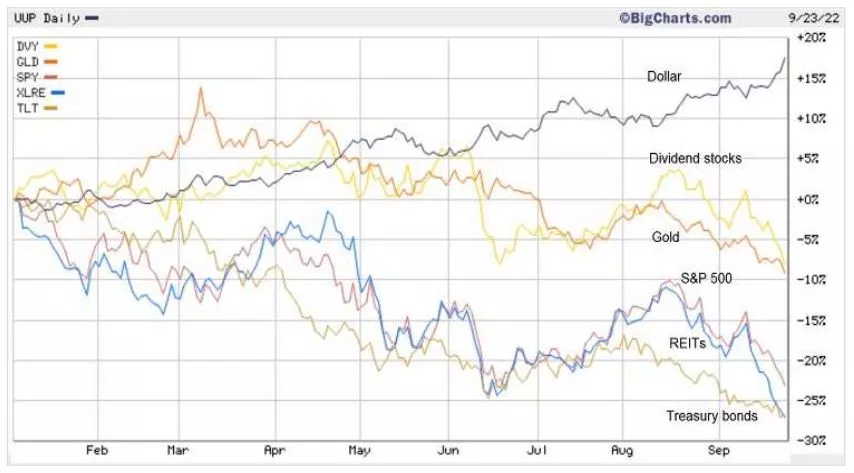
You can see TLT and SPY are both down well over 20%. The dollar has been quite strong this year—steadily rising since May 2021—while all other asset classes have been weak. Gold spiked higher when Russia invaded Ukraine but has been falling ever since. September has brought heightened uncertainty (including serious nuclear threats from Russia), causing a surge in the dollar and severe selloffs in S&P 500, REITs, and dividend stocks. Even the powerful Energy sector (not shown) has taken a nosedive in September, culminating in a capitulation-type day (-7%) on Friday with some of the sector’s stronger stocks falling 10% or more on the day.
But this might change soon. The 10-year Treasury note has quickly spiked to as high as 3.77% (its highest since 2010) before closing at 3.69% on Friday, while the S&P 500 dividend yield is only 1.52% and its “earnings yield” (inverse of 16.0x P/E) is 6.25%. So, as the equity risk premium (difference between earnings yield and risk-free Treasury yield) has fallen, there is less upside potential in the P/E multiple, further improving the relative attractiveness of bonds. With recession likely and knowing that capital markets are forward discounting (i.e., already pricing in expected Fed rate hikes), it seems that idle cash will soon flow into bonds. According to the Bank of America Global Fund Manager Survey in mid-September, 62% were overweight cash with an average cash balance of 6.1%—the highest since October 2001, following the 9/11 attack—and a risk appetite on par with March 2020 (the pandemic low). The bank labeled sentiment “super bearish.”
So, although bond prices keep falling (and yields keep rising) in concert with stocks, there will come a time (perhaps quite soon) when investors can no longer pass up such juicy yields (again, the highest since 2010). This in turn drives down yields, which gives stocks more opportunity for multiple expansion. From a technical (chart) perspective, the 10-year yield is quite overextended after its bullish breakout from a bearish “head & shoulders top,” as hawkish Fed jawboning has artificially pushed up yields, in my view.
Inflation and excess demand:
With August CPI coming in hotter than expected at 8.3% YoY, some commentators assert that inflation has become embedded in the economy and that current readings for food and shelter correlate with prior periods of structural inflation. They say the Fed’s only solution is harsh monetary policy that drives us into deep recession, and, historically, the fed funds rate must go above the inflation rate to get such inflation under control. But I say, whoa, not so fast ... let’s think this through.
My view is that artificially disrupted supply chains are a key differentiator today versus previous periods of high inflation. So, rather than normal economic forces creating supply/demand imbalances, consumer demand quickly snapped back to pre-pandemic levels thanks to governmental monetary and fiscal largesse, while supply was constrained by supply chains (which include manufacturing, transportation, logistics, energy, and labor) hobbled or destroyed by forced lockdowns and war. Fed chair Powell even mentioned this in his latest post-FOMC press conference on 9/21. So, to close the gaping excess demand gap, aggregate demand simply had to be depressed enough to buy time for supply chains to gradually mend—and both are happening.
What mainly spooked the market after the August CPI release was a surprise increase in core inflation (after 4 straight months of falling or stable readings). However, it was driven mostly by shelter costs (including both rent and owner-equivalent rent), which are just now starting to stabilize (or even recede) as rising mortgage rates and recession fears quell demand, which should begin to show up in future CPI prints. Meanwhile, key prices like oil, commodities, and transportation have fallen precipitously. Importantly, wage growth is finally showing signs of slowing (although it is not yet falling, and the FOMC feels job openings and quit rates must decline before there can be a significant reduction in wage and price inflation).
Also, August PPI fell once again, this time by -0.1% versus July. It follows a July reading that was down -0.5% versus June, which was the first decline in producer prices since April 2020. From an historical perspective, large moves to negative PPI readings have led to significantly lower inflation over subsequent months.
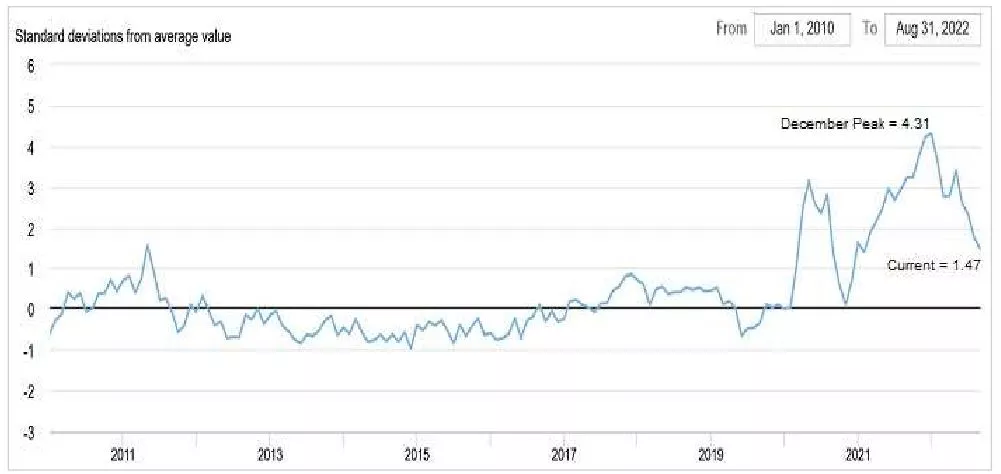
In addition, the New York Fed’s Global Supply Chain Pressure Index (GSCPI) has been falling rapidly, as shown in the chart below, from a December high of +4.31 to the August reading of +1.47 (number of standard deviations from the average value, aka Z-score). Note that for most large data sets of any kind, it is rare to see a Z-score fall outside the range of -3 to +3, so the December high reflected notably extreme pressures on supply chains, which are coming down fast.
Gold prices continue to languish due to the ultra-strong dollar and rising real interest rates (nominal rate minus inflation). Historically, gold thrives when inflation rises and real interest rates fall, leading to a weaker dollar, which makes gold attractive as a store of value. But there has been no rush among investors to hold gold, which indicates an investor expectation of falling inflation.
Supply chains and labor markets are continuing a gradual recovery, the US dollar remains strong (which helps keep down prices of commodities like oil and gold that are priced in dollars), and the Fed is pursuing “demand destruction” through hawkish language, rate hikes, and reduced M2 growth. In addition, positive catalysts like an end to Russia’s war on Ukraine or China’s COVID lockdowns, and/or midterm elections that bring greater support for domestic oil & gas production, all would be expected to hasten improvement in supply chains and have an immediate positive impact on inflation.
The latest FOMC announcement made it quite clear that the Fed intends to tamp down inflation at any cost (even if it means a recession, rising unemployment, and a weaker stock market), with another 125-bp increase in fed funds rate beyond the 75 bps just announced, which would bring the range to 4.25-4.50%. Nevertheless, despite the monotonic surge in yields since August 1, I think it is mainly driven by the Fed’s fear-inducing jawboning, and I still believe both inflation and bond yields are in the midst of volatile topping patterns. Which means both should soon fall, lowering the discount rate on long-duration growth stocks, ultimately leading to rising equity prices. The only question is timing. For the moment, Powell has been mercilessly “talking up” bond yields, while implying there would be no protective “Fed put” to support the economy or stock prices.
On that note, my view is that the fed funds rate has already far surpassed the “neutral rate” (neither stimulates nor depresses economic growth), given how sensitive the highly leveraged US and global economies (including governments, businesses, and consumers) have become to debt financing costs. Consumer demand is being depressed, and the economy looks heavily burdened.
US dollar, money supply, and corporate earnings:
What I haven’t heard the media ask of Fed chair Powell are any questions about money supply. The Fed must ensure a sufficient global supply of dollars in a world hungry for them—given that 85% of foreign exchange transactions, 60% of foreign exchange reserves, and 50% of cross-border loans and international debt are in US dollars. This limits the Fed’s flexibility to shrink its balance sheet.
Moreover, hawkish US monetary policy diverges from the accommodative policies in Japan and China and massive fiscal intervention in the EU and UK. As a recent Bloomberg headline said, “The US is Exporting Inflation, and Fed Hikes Will Make It Worse.” So, to keep the dollar from getting any stronger than it already is, the Fed may be forced to ease up on its inflation focus, pause on further rate hikes, and start printing more dollars (and perhaps even buy foreign sovereign debt) in order to weaken the US dollar and bolster other major currencies. Perhaps this is why the Fed has been relying so much on tough talk while avoiding talking about M2 money supply—so that it wouldn’t have to reduce its balance sheet so much.
Speaking of the Fed balance sheet, QE meant years of buying Treasuries at much lower yields (and much higher prices) than today.So, besides not offsetting its outgoing payments on higher-yielding new debt issued to fund the government, selling existing bond holdings at a capital loss through QT (rather than waiting for them to mature and roll off the balance sheet) could lead to the Fed’s first calendar-year operating loss since 1915. Perhaps this is another reason why Powell is reticent to talk about money supply.
Finally, let’s not forget about corporate earnings, which along with interest rates are the two most important factors for stock valuations. Profit margins have held up well this year (despite higher producer prices and falling labor force productivity), with an average of 12.3%, according to FactSet, which is down only slightly from last year’s impressive 12.7%. However, the narrowing gap between PPI and CPI might suggest some margin compression ahead.
Nevertheless, as Q3 earnings reporting season starts in mid-October, aggregate EPS for the S&P 500 is expected to increase by +2.8% YoY to 56.19/share, which is down from the healthy +9.8% growth expectation at the end of June but still positive (although 7 out of 11 sectors are expected to show negative growth). For Q4, the consensus is $58.10/share, and for 2023, Wall Street now forecasts $242.31/share, which at the current 3,700 on the S&P 500 index implies a forward P/E of only 15.3x, so there is room for multiple expansion (e.g., an 18x forward multiple would put the S&P 500 at 4,361 by year end, and a 17x multiple would equate to 4,119).
Investors now await with anticipation Q3 earnings season, the September CPI print on 10/13, and the next FOMC statement on 11/2, which is right before the midterm elections (although much of the electorate does early voting and vote-by-mail these days).
So, how did we end up in a position where we listen with bated breath to every nuanced word from the Fed? And why does the Fed wield so much influence over our investments and livelihoods? Well, first the Fed inflated markets with money supply (i.e., asset inflation) while our elected leaders enacted forced lockdowns and massive transfer payments. It then trickled over into CPI inflation due to broken supply chains, labor shortages, and falling productivity caused by those lockdowns. So, now the Fed is struggling to let the air back out via a “financial lockdown,” even as our elected leaders are enacting even more spending programs that the Fed will have to fund.
Unfortunately, we reap what we sow. We have become a society that looks to our government to “do something” (including meddling with the free markets) whenever a segment of the broad citizenry faces a challenge. When usually the wisest course of action would be to do nothing and simply stay out of the way of market forces and the private sector, instead our elected and appointed (i.e., unelected) leaders jump into action to make often ill-advised decisions, whether it be interest rate cuts (ZIRP) or massive liquidity injections (QE); new laws, regulations, or congressional spending programs that pick winners and losers; or declarations of national emergency as a pretense to suspend our civil liberties. However well-intentioned they may be, it seems to me that such knee-jerk policymaking often causes more damage than it prevents. As Confucius once said, “Life is really simple, but we insist on making it complicated.”
Active selection should outperform passive indexes:
Overall, in spite of today’s precarious macro climate—including elevated inflation, interest rates, and energy prices; war in Europe, disrupted supply chains, and supply/demand imbalances; continued COVID lockdowns and slowing growth in China; massive global debt and uncertain Federal Reserve policies; not to mention midterm elections amid a hyper-polarized and suspicious society— we continue to suggest investors stay long but hedged, with a heightened emphasis on quality and a balance between value/cyclicals/dividend payers and high-quality secular growers.
However, the passive, broad-market, mega-cap-dominated indexes that have been so hard for active managers to beat in the past, might not be the best place to park your funds today. After all, Warren Buffett’s favorite indicator, the ratio of total market capitalization to GDP, sits at about 2.4x, which—although down from the recent all-time high of 2.7x—is still near historical highs and well above the 2.1x level during the dot-com bubble of 2000.
Thus, it seems likely that passive index returns may be volatile and uninspiring, so the time may be ripe for active strategies that can exploit the performance dispersion among individual stocks. On that note, Sabrient’s new portfolios—including Q3 2022 Baker’s Dozen, Forward Looking Value 10, Small Cap Growth 35, and Dividend 41 (sporting a 5.5% yield!)—leverage our enhanced model- driven selection approach (which combines Quality, Value, and Growth factors) to provide exposure to both the longer-term secular growth trends and the shorter-term cyclical growth and value-based opportunities. By the way, all reflect an overweight allocation to the Energy sector. [Notably, the Energy Select Sector SPDR (XLE) sports a forward P/E of only 7.1x and a forward PEG of 0.40.].
Performance Update:
Sabrient’s GARP model combines growth, value, and quality factors while searching across all market caps to find opportunities. Our portfolio line-up comprises the quarterly Baker’s Dozen, Dividend, and Small Cap Growth portfolios, and the annual Forward Looking Value portfolio. As I have explained in the past, market divergences in 2018-19 (especially due to the trade war with China) were different from anything we had seen in developing our longstanding high-performing model and portfolio selection process, and it severely impacted our performance as well as most other value-biased strategies.
However, rather than simply wait for our model to “start working again,” we created and implemented new process enhancements in December 2019 to
produce portfolios displaying a better balance between cyclical and secular growth companies and across market caps, lower volatility relative to the
benchmarks, and greater portfolio resiliency (i.e., “all weather”). Indeed, the enhanced process has improved relative performance across all our
portfolios, as has the market’s rotation away from a preference for aggressive growth and speculative stocks into a preference for value and quality.
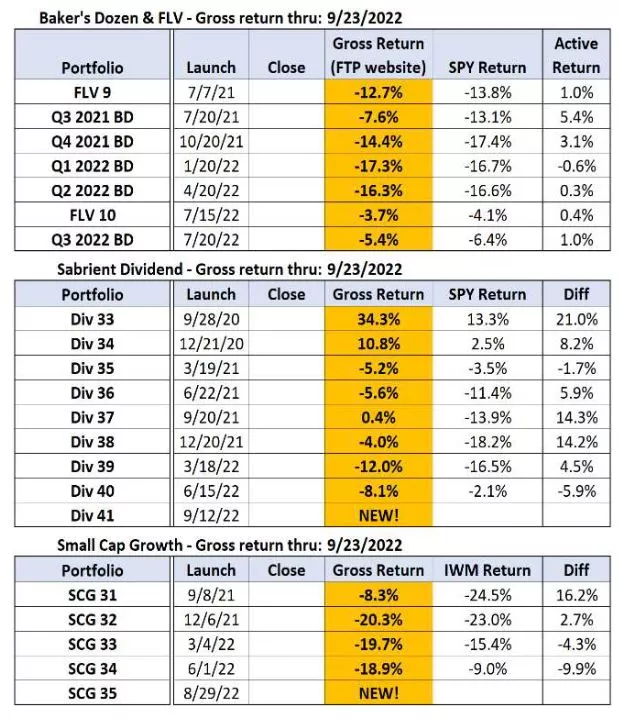
In fact, 15 of the 19 live portfolios (leaving out the newly launched ones) are outperforming or staying even (within 1%) with their benchmarks [i.e., S&P
500 (SPY) and Russell 2000 (IWM)] despite the bear market this year. As shown in the table on the right, gross total returns through 9/23 come from
the ftportfolios.com website (without transactional sales charge).
Notably, our Sabrient Dividend Portfolio has been performing quite well. It is different from most high-yielding dividend products in that it seeks both capital appreciation and reliable income by identifying quality companies selling at an attractive price with a solid growth forecast, a history of raising dividends, a good coverage ratio, and a target dividend yield in of 4% or more (note: Dividend 41 is currently yielding 5.5%).
Update on the Soon-to-Terminate Q3 2021 Baker’s Dozen Portfolio:
The Q3 2021 Baker’s Dozen will terminate next month, on 10/20. Like all our portfolios, it was selected based on Sabrient’s forward-looking GARP selection approach that relies upon the consensus EPS growth estimates of the sell-side analyst community. It launched on 7/20/2021 with an overweight (54% vs. 24% in the benchmark) in attractively valued “deep cyclical” sectors (Financials, Industrials, Materials, and Energy), i.e., 7 positions out of 13, plus 2 from Consumer Discretionary. It was slightly underweight the benchmark (31% vs. 40%) for secular growth Technology and Healthcare (4 positions). As for
Value vs. Growth exposure, the portfolio launched with 38% allocation (5 positions) to the Growth factor, versus the benchmark’s 60% weight (as the cap-weighted index is dominated by mega-cap Growth stocks). Lastly, it had a small-mid cap bias relative to the S&P 500 large cap benchmark, with 2 large, 7 mid, and 4 small caps (although top-performer ON Semiconductor has grown into a large cap since launch).
As you can see in the table below, about half the holdings have met or exceeded EPS estimates, but all have been subjected to significant P/E multiple contraction.
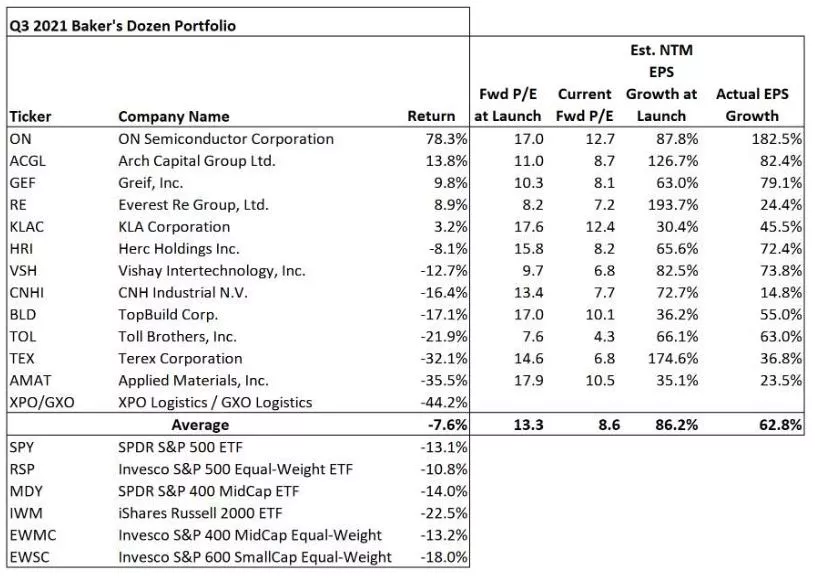
Over the life of the portfolio so far (7/20/2021-9/23/2022), the gross total return of the model portfolio is -7.6% versus -13.1% for the
S&P 500 index and -22.5% for the Russell 2000. So, it has held up much better than its relevant benchmarks shown. Top performers include ON Semiconductor (ON), which makes semiconductors for electric vehicles and power solutions, insurer/reinsurers Arch Capital Group (ACGL) and Everest Re Group (RE), and industrial packaging maker Greif (GEF).
Of course, in a concentrated 13-stock portfolio, one or two breakout winners can offset several losers, and ON has been the big star, offsetting laggards like trucking firm XPO Logistics (XPO), which spun off part of its operations as GXO Logistics (GXO), semiconductor equipment maker Applied Materials (AMAT), construction machinery maker Terex (TEX), and homebuilder Toll Brothers (TOL). Notably, TOL and homebuilding materials firm TopBuild (BLD) both either met or beat EPS estimates and have solid forward growth forecasts, and yet they are both down about 20% with forward P/Es that have been slashed by 40%! We have heard this story before, when fearful investors apparently don’t believe (or care about) Wall Street’s consensus estimates.
Update on the Latest Q3 2022 Baker’s Dozen Portfolio:
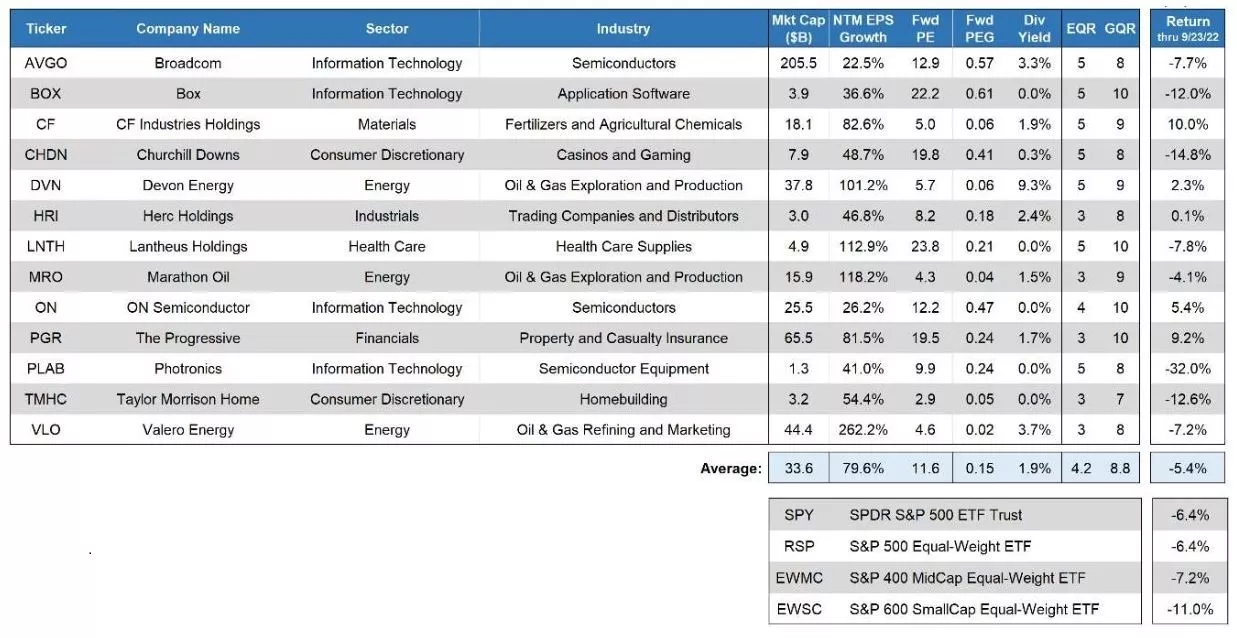
The latest Q3 2022 Baker’s Dozen launched on 7/20, and it got off to a strong start before the market weakness set in, which cut into its strong active return versus the benchmark. Its 13 holdings are shown in table below, along with statistics on forward valuation, consensus next-12-months (NTM) EPS growth expectations, forward PEG ratio (P/E divided by EPS growth) and two key scores: Earnings Quality Rank (EQR, 1-5 scale, with 5 the best) and Growth Quality Rank (GQR, 1-10 scale, with 10 the best). Also shown is performance to date (9/23)..
semiconductor equipment maker Applied Materials (AMAT), construction machinery maker Terex (TEX), and homebuilder Toll Brothers (TOL). Notably, TOL and homebuilding materials firm TopBuild (BLD) both either met or beat EPS estimates and have solid forward growth forecasts, and yet they are both down about 20% with forward P/Es that have been slashed by 40%! We have heard this story before, when fearful investors apparently don’t believe (or care about) Wall Street’s consensus estimates.
Update on the Latest Q3 2022 Baker’s Dozen Portfolio:
The latest Q3 2022 Baker’s Dozen launched on 7/20, and it got off to a strong start before the market weakness set in, which cut into its strong active return versus the benchmark. Its 13 holdings are shown in table below, along with statistics on forward valuation, consensus next-12-months (NTM) EPS growth expectations, forward PEG ratio (P/E divided by EPS growth) and two key scores: Earnings Quality Rank (EQR, 1-5 scale, with 5 the best) and Growth Quality Rank (GQR), 1-10 scale, with 10 the best). Also shown is performance to date (9/23). The portfolio has a diverse mix across market caps, with 5
large caps, 4 mid-caps, and 4 small caps; a 6/7 split between value and growth stocks; and a 7/6 split between cyclical and secular growers. As for
sectors, there are 4 Technology names, 3 Energy, 2 Consumer Discretionary, 1 Materials, 1 Industrials, 1 Healthcare, and 1 from Financials. Some are familiar names, like The Progressive (PGR) and Broadcom (AVGO), while others are more “under the radar,” like photomask maker (for semiconductor
manufacturing) Photronics (PLAB) and medical diagnostics firm Lantheus Holdings (LNTH). Notably, CF Industries (CF) is the top performer at +10%, but just last month it hit a new all-time high and was up +35% before the fertilizer industry got hit this month.
You can find more detail on this portfolio by downloading the full Holdings report.. The report describes each of the 13 stock picks in greater detail, including a brief description of each company and what makes them attractive. You also can download my latest slide deck and market commentary. In addition, I go into greater detail on market conditions and outlook in my periodic Sector Detector newsletter and blog posts.
Final Comments:
As a reminder, we implemented process enhancements in December 2019 to our GARP model and “quantamental” portfolio selection methodology (which uses the quantitative model as a prescreen and then uses a fundamental review and final selection approach that includes forensic accounting analysis by our Gradient Analytics subsidiary). This has made our portfolios more “all weather” by reducing volatility relative to the benchmark and allowing companies that display consistent and reliable earnings growth to score more competitively in our value-biased GARP model, even if they display somewhat higher valuations. The enhanced process seeks to provide exposure to both the longer-term secular growth trends and the shorter-term cyclical growth opportunities ... without sacrificing the potential for significant outperformance.
Indeed, with relative performance looking good once again, we believe Sabrient’s portfolios – including the new Q3 2022 Baker’s Dozen (launched on 7/20), Forward Looking Value 10 (launched on 7/15), Small Cap Growth 35 (launched on 8/29), and Sabrient Dividend 41 (launched on 9/12, and today offers a 5.5% yield)—are positioned to outperform passive benchmarks. If indeed the market is pounding out a technical bottom, inflation is retreating, and the Fed is soon to pivot to neutral (or even dovish), this may be a great buying opportunity for our portfolios.
More By This Author:
Signs That Inflation May Be Waning
It All Rides On Inflation And The Fed, But Signals Are Looking Bullish
Investors Await Bullish Catalysts As Inflation, Interest Rates, And Money Supply Growth Show Signs Of Topping
Disclaimer: Opinions expressed are the author’s alone and do not necessarily reflect the views of Sabrient. This newsletter is published solely for informational purposes and is not to be ...
more


