

Image Source: Pixabay
The S&P 500 officially entered a bear market by falling more than -20% from its all-time high in January, with a max peak-to-trough drawdown of nearly -25% (as of 6/17). The Nasdaq Composite was down as much as -35% from its November all-time high. During the selloff, there was no place to hide as all asset classes floundered – even formerly uncorrelated cryptocurrencies went into a death spiral (primarily due to the forced unwinding of excessive leverage). But then stocks staged an impressive bounce last week, although it was mostly driven by short-covering.
Earlier this year when stocks began their initial descent, laggards and more speculative names sold off first, but later, as the selling accelerated, the proverbial baby was thrown out with the bathwater as investors either were forced to deleverage (i.e., margin calls) or elected to protect profits (and their principal). Even the high-flying Energy sector sold off on this latest down leg, falling over -25% intraday in just 10 days, as the algorithmic momentum trading programs reversed from leveraged buying of Energy to leveraged selling/shorting.
These are common signs of capitulation. So is historically low consumer and investor sentiment, which I discuss in detail later in this post. But despite the negative headlines and ugly numbers, it mostly has been an orderly selloff, with few signs of panic. The VIX has not reached 40, and in fact, it hasn’t eclipsed that level since April 2020 during the pandemic selloff. Moreover, equity valuations have shrunk considerably, with the S&P 500 and S&P 600 small caps falling to forward P/Es of 15.6x and 10.8x, respectively, at the depths of the selloff (6/17). This at least partially reflects an expectation that slowing growth (and the ultra-strong dollar) will lead to lower corporate earnings than the analyst community is currently forecasting. Although street estimates have been gradually falling, consensus still predicts S&P 500 earnings will grow +10.4% in aggregate for CY2022, according to FactSet. Meanwhile, Energy stocks are back on the upswing, and the impressive outperformance this year of the Energy sector has made its proportion of the S&P 500 rise from approximately 2% to 5%...and yet the P/Es of the major Energy ETFs are still in the single digits.
A mild recession is becoming more likely, and in fact, it has become desirable to many as a way to hasten a reduction in inflationary pressures. Although volatility will likely persist for the foreseeable future, I think inflation and the 10-year Treasury yield are already in topping patterns. In addition, supply chains and labor markets continue their gradual recovery, the US dollar remains strong, and the Fed is reducing monetary accommodation, leading to demand destruction and slower growth, which would reduce the excess demand that is causing inflation.
Bullish catalysts for equity investors would be a ceasefire or settlement of the Russian/Ukraine conflict and/or China abandoning its zero-tolerance COVID lockdowns, which would be expected to help supply chains and further spur a meaningful decline in inflation – potentially leading to a Fed pivot to dovish (or at least neutral)…and perhaps a melt-up in stocks. Until then, a market surge like we saw last week, rather than the start of a V-shaped recovery, is more likely just a bear market short-covering rally – and an opportunity to raise cash to buy the next drawdown.
In this periodic update, I provide a comprehensive market commentary, offer my technical analysis of the S&P 500 chart, review Sabrient’s latest fundamentals-based SectorCast quant rankings of the ten US business sectors, and serve up some actionable ETF trading ideas. To summarize, our SectorCast rankings reflect a bullish bias, with 5 of the top 6 scorers being cyclical sectors. In addition, the near-term technical picture looks neutral-to-bearish after last week’s impressive bounce, and our sector rotation model remains in a defensive posture.
Commentary:
Last week was only the second week in the last 12 (since late March) in which the S&P 500 was positive. With Fed chair Powell verbally committing to a preference for a recession over inflation during his various testimonies last week, stocks celebrated – particularly the major cap-weighted indexes that are dominated by the mega-cap, secular growth juggernauts, like Microsoft (MSFT), Apple (AAPL), Alphabet (GOOGL), and Amazon.com (AMZN).
Some observers think that a “recession trade” is already underway. Indeed, falling energy and commodities prices would indicate slowing global growth. Industrial metals are on track for their worst quarter since the 2008 financial crisis. Copper (which is considered an economic bellwether) hit its lowest price since early 2021. The 10-year Treasury yield surged to almost 3.5% on 6/14 (as all asset classes sold off), but it pulled back last week to as low as 3.0%, while growth stocks rallied (on the lower discount rate), as did housing (on lower mortgage rates) and defensive sectors like Healthcare, Consumer Staples, Telecom, Utilities, and REITs. Recessions typically lead to falling yields as investors embrace the relative safety and income of bonds and “bond proxies” (like safe dividend-paying stocks) – and lower yields are also favorable for secular growth companies.
Inflation, yields, and Fed policy:
It is evident that CPI inflation has been a direct result of 1) ballooning money supply through both monetary and fiscal policies to maintain consumer demand in reaction to the pandemic lockdowns, combined with 2) ongoing supply chain disruptions from the lockdowns (encompassing manufacturing, transportation, logistics, labor, and energy) that were further exacerbated by Russian’s invasion of Ukraine, blockades, and the subsequent economic sanctions. Now the Fed is trying to address it through quantitative tightening with higher interest rates and a reduction in money supply growth.
The FOMC decided at its June meeting to raise the discount rate by 75 bps (its largest single increase in 28 years), with only one voting member dissenting (preferring instead 50 bps). This puts the fed funds rate range to 1.5-1.75%, with another 50-75 bps rate hike telegraphed for the next meeting in July. The Fed’s consensus “dot plot” now indicates its fed funds rate will reach 3.375% by year-end – and every FOMC voting member thinks the rate will finish the year above 3.0%. Nevertheless, I continue to believe that the Fed in reality is hoping its tough talk will induce investors to push up market rates and suppress demand so that it doesn’t have to later cut rates to re-stimulate a recessionary economy. As I have often opined, the economy has been too “financialized” and dependent on low-interest rates, and there is a big difference in an entity’s cash flow between raising financing rates from 2 to 4% versus prior periods of rising rates from, say, 6 to 8%. Although both end up 2% higher, it’s a 100% increase in debt carrying cost versus a 33% increase.
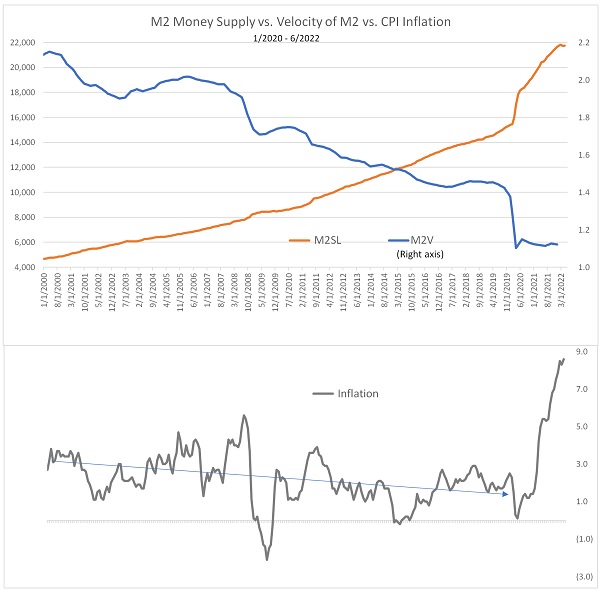
The chart below shows M2 money supply growth since 1/1/2020 plotted versus the Velocity of M2 money supply, with inflation plotted just below it. You can see that even as M2 grew rapidly up until the COVID pandemic, inflation was in a downtrend because the velocity of money was falling commensurate with the M2 growth. The multiplier effect of the money supply was too benign to juice inflation. However, after the pandemic hit, M2 surged and the velocity of M2 tumbled, and yet inflation suddenly spiked. Why? Because of the severe supply chain disruptions while fiscal and monetary policy kept demand at pre-pandemic levels. So, to bring down inflation, either supply chains have to be repaired or demand must fall…or a bit of both.
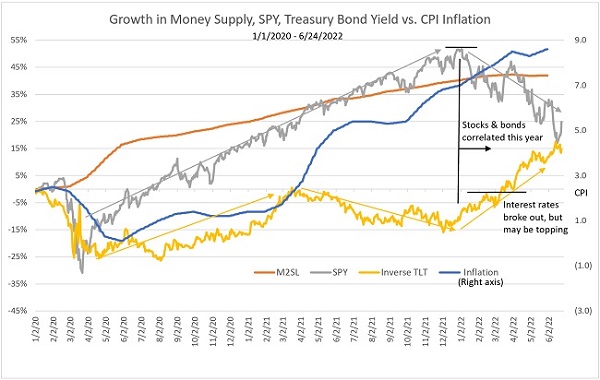
Historically, stock market selloffs were tempered by the transfer of principal into bonds, which led to a drop in yields, thus lowering the risk-free rate for a discounted cash flow analysis, which supported valuations with a higher equity risk premium. But that hasn’t been the case this year as stocks and bonds have fallen together (along with most other assets). The chart below illustrates this. It shows the relative growth rates of the M2 money supply, Treasury bond yields (represented by the inverse of the TLT ETF), and the S&P 500 plotted against CPI inflation since 1/1/2020. As stocks rose rapidly along with M2 in the wake of the pandemic selloff all the way through the 2021 Santa Claus rally, Treasury bonds seemed relatively uncorrelated – but inflation was also on a rapid rise, with CPI reaching 7%. Then, at the start of 2022, with the specter of Russian troops gathering at the Ukraine border and the Fed pivoting too much more hawkish language, equities began a rapid descent…along with bonds (and most other asset classes). Falling bonds pushed up yields and exacerbated the selloff in stocks (by raising the discount rate and lowering the equity risk premium), particularly as rates broke out above 2021 highs to levels not seen since 2018 (just prior to the Q4 2018 selloff).
Looking ahead, however, the Fed has slowed M2 money supply growth dramatically, and I believe Treasury yields and inflation are both in topping patterns. And if we get a mild recession, I expect global capital to flow into bonds, bringing yields down further. Historically, the only time yields didn’t fall during a recession was when we had the dreaded “stagflation” (rising inflation combined with low or stagnant economic growth). But with money supply growth slowing, demand destruction underway, and supply chains recovering, my bet is on falling inflation and yields…and limited stagflation.
As I have discussed, there is little the Fed can do with a monetary policy other than crush demand. Making things harder, new government spending on infrastructure projects is at odds with the Fed’s attempt to suppress demand by competing for the scarce supply of construction materials and labor. We need to assist the Fed in its inflation battle on the fiscal side with less government spending (including entitlement reform). Moreover, regulatory reform is needed to help boost the supply side. For example, fuel prices have skyrocketed, but oil companies for many years have not been able to economically justify expanding refining capacity because of onerous regulations and the length of time required for project payout in the face of the anti-hydrocarbon policies. Another strategy that would help is to boost the labor participation rate by promoting career and technical education that teach marketable skills rather than always pushing college liberal arts degrees that often leave graduates with massive debt and few job prospects.
As for corporate earnings, Q2 reports will start soon, and they surely will reveal inflation is hurting margins. Because multinationals in the S&P 500 get a lot of revenue from overseas and then convert those sales from weaker currencies into strong dollars, current EPS estimates might be hard to achieve. Stocks have sold off faster than earnings estimates have come down due to a combination of deleveraging (largely due to margin calls), the Fed “talking up” interest rates with hawkish rhetoric, and an investor shift from speculative fervor (“animal spirits”) to demanding actual (and high quality) profits. But I think as inflation begins to recede in 2H, investors will be willing to allow some expansion in valuation multiples (P/E ratio) in anticipation of improving margins down the road. According to the St. Louis Fed as of 6/27, the 5-year Breakeven Inflation Rate has fallen to 2.79%, and the 5-year/5-year Forward Inflation Expectation Rate is only 2.31%, which gives an indication of what the institutional market expects. Also, the University of Michigan Inflation Expectations survey of consumers, which presents the median expected price change for the next 5 years, fell to 3.1%.
Historically, signs of a slowing economy (and perhaps headed toward recession) include a flattening yield curve, rising inflation – both of which commenced in 2021 – plus rising corporate credit spreads, elevated stock market volatility (consistently above 20), and a Fed pivot from dovish to hawkish – all of which materialized this year. And then, of course, the trends were exacerbated by Putin’s war and shipping blockades and the ensuing sanctions (severely impacting supplies of oil & gas, wheat, corn, and fertilizer). Because inflationary pressure since the pandemic lockdowns has been so supply-driven, any resolution to the China lockdowns (which are already showing signs of improvement) in the near term and Putin’s war and associated sanctions in the longer term are the best bets to stem inflation via supply before the Fed induces too much demand destruction.
Unfortunately, the Fed can’t fix supply chains or turn its money printer into a 3D printer to make oil, semiconductors, or fertilizer. However, the New York Fed’s Applied Macroeconomics and Econometrics Center (AMEC) has begun monthly publication of a Global Supply Chain Pressure Index (GSCPI) to assess the intensity of global supply chain disruptions based on data from the transportation and manufacturing sectors. This index has eased this year from its reading of 4.38 at the start of the year to 2.90 at the end of May. Moreover, many commodity prices (other than energy, primarily due to sanctions on Russia) have been in retreat for the past few weeks, including fertilizer, steel, copper, and lumber.
Consumer and investor sentiment:
Historically, market capitulation usually comes when sentiment is at its lowest. And lately, sentiment has been downright awful, which is typically bullish from a contrarian standpoint. The American Association of Individual Investors' weekly survey of bullish investor sentiment came in last week (6/22) at a dismal 18.2% (although higher than the 16.4% reported on 4/28). Bullish sentiment remains below its historical average of 38.0% for the 31st consecutive week, and “at an unusually low level” (as described by AAII) for 18 of 22 weeks. Notably, readings below 20% are historically rare, and in almost every previous instance, stocks rallied strongly over the ensuing 6 and 12 months.
A recent Wall Street Journal/NORC poll (May 2022) showed that 83% of respondents (from over 1,000 adults, with a 95% confidence level) believed the US economy was in a “poor” or “not so good” state, with 44% said it was a bad time to invest in stocks, and 35% were unhappy with their financial situation, which is the highest level of dissatisfaction since the survey began in 1972. Amazingly, respondents today are more unhappy than they were during the 2008 financial crisis. So, perhaps there is some recency bias at play here (after years of prosperity and low inflation) – and perhaps it reflects the rapid rise in partisan news outlets and social media “echo chambers” that exacerbate the level of anger, polarization, and demonization of “the other side.”
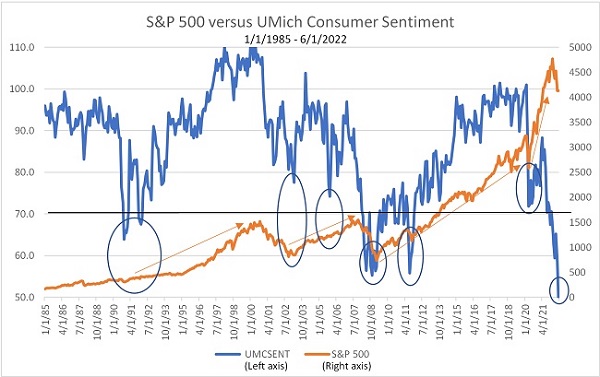
As for consumers, the Conference Board Consumer Confidence Index decreased again in June, falling to 98.7 (1985=100), which is down from 103.2 in May and the lowest since February 2021 (95.2). In addition, the University of Michigan Consumer Sentiment Index's final estimate for June fell to 50.0 (an all-time low since the index launched in 1977), which illustrates how damaged and frustrated are consumers (whose spending, as a reminder, makes up 70% of the economy). Encouragingly, a recent study identified six times in history where this index dropped to ultra-low levels (i.e., below 65), and in each instance, stocks rallied over the ensuing 12 months with an average gain of 24%.
As for the large institutional fund managers (those with over $1 trillion in AUM), they recently reported holding their highest levels of cash in 20 years. And BofA's proprietary Bull & Bear indicator of professional trader sentiment has hit 0.0 on a 0-10 scale, so it can’t get any lower. According to BofA, the indicator previously fell to zero in previous moments of extreme economic anxiety in August 2002 (dotcom bubble burst), July 2008 (financial crisis), September 2011 (the European sovereign debt crisis and US credit downgrade), September 2015 (China weakness and currency devaluation, Fed tightening, FAANG-or-nothing), and March 2020 (COVID lockdowns, “two weeks to flatten the curve”).
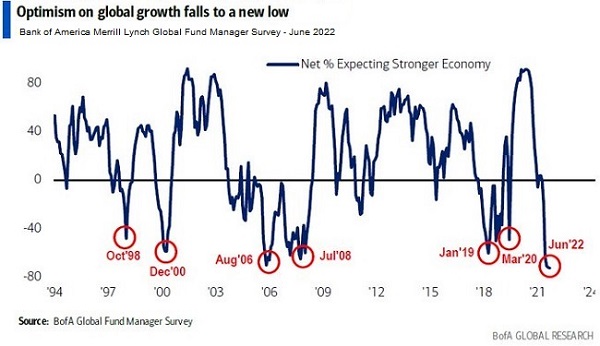
Also, the Bank of America Merrill Lynch Global Fund Manager Survey is a monthly questionnaire that asks a few hundred fund managers how they feel about the markets and how they are investing. In the June survey, the net percentage of fund managers expecting a stronger economy fell to an all-time low (since the survey was launched in 1994), as shown in the chart below. In addition, only 12% expect above-trend global economic growth over the next 12 months. A vast majority (67%) think oil and commodities are the best investment right now, greatly outdistancing emerging markets, gold, T-bills, T-bonds, S&P 500, and bitcoin. They see hawkish central banks, global recession, and persistent inflation as by far the biggest tail risks, much more than war, COVID, or anything else. In June, fund managers said they are still holding a lot of cash as a percentage of total AUM, with 5.6% cash allocation, which is down from 6.1% in May but still on par with the pandemic selloff and the Great Financial Crisis.
From a contrarian standpoint, excessive pessimism is bullish. The stock market is a leading indicator that tends to move up in advance of improving data. And from a historical perspective, such divergence between the actual economy and sentiment tends to converge rapidly. Other encouraging signs include indications of massive buying programs among institutional traders, and the insider buy-sell ratio recently hit its highest level since March 2020, reflecting behavior consistent with historical market bottoms.
Final thoughts:
Although the Fed likely will raise rates another 50-75 bps in July, I stand by my view that it will not raise as much as the market is pricing in, and indeed the Fed may instead be forced to ease later this year or early next year. I think interest rates will start to come down as demand destruction sets in, bonds catch a bid, disinflationary structural trends resume, and the Fed decides it must resume buying bonds to ensure financial liquidity (i.e., a sufficient global supply of US dollars) in a world hungry for dollars. Furthermore, with global GDP at about $85 trillion and total global debt estimated at more than $300 trillion, rising interest rates put a tremendous burden on the global economy to service the debt. This puts the Fed between a rock and hard place with its limited tools to fight inflation.
I still expect a sequence of events over the coming months as follows: more hawkish Fed rhetoric and further tightening actions, modest demand destruction, a temporary economic slowdown or mild recession, and more stock market volatility…followed by mending supply chains, some catch-up of supply to slowing demand, moderating inflationary pressures, bonds continuing to find buyers (and yields falling), and a dovish/neutral/less-hawkish pivot from the Fed – ultimately leading to a rising stock market. But again, rather than investing in the major cap-weighted index ETFs, stocks outside of the big-name mega-caps may offer better opportunities due to lower valuations and higher growth rates.
Investors are wondering why gold hasn’t provided better performance this year. Many pundits have continued to predict an imminent gold rally, but it has been elusive mostly due to the ultra-strong dollar and expectations for rising real interest rates (nominal rate minus inflation). Typically, a rise in inflation tends to be favorable for gold due to falling real interest rates and a weaker dollar, which makes gold attractive as a store of value. However, today’s inflation is not having that impact. Instead, the forecast for nominal interest rates is to keep rising (“normalization”) while future inflation expectations are falling (due to demand destruction and mending supply chains) and the dollar remains strong versus other major currencies. As a result, gold has essentially flatlined.
As for cryptos not serving as a stock market hedge or store of value, recently they have become highly correlated with speculative aggressive-growth stocks, such as those held by the ARK Innovation ETF (ARKK), which is down -52% YTD. And due to high leverage (i.e., greed), the crypto selloff became the proverbial “snowball” that feeds on itself, exacerbated by margin calls and forced liquidations. Many investors were levered as much as 10-20x, with visions of yachts, Maserati’s, and “bitcoin millionaire” status dancing in their heads. Nevertheless, it should be comforting to know that the crypto selloff wasn’t due to a loss of confidence in the growing use case for blockchain, distributed ledger technology (DLT), and cryptocurrencies. The technology is unstoppable and will revolutionize many aspects of our lives as the foundation for the next generation of the internet (aka Web 3.0), banking, money transfers, capital markets, accounting, compliance, “Know Your Customer” (KYC), insurance claims, legal contracts, cybersecurity, voting, supply chain management, healthcare database management, real estate transactions, intellectual property (IP) rights, non-fungible tokens (NFTs) and authentication of property (e.g., art, music), tax filing, data management, and pretty much anything else that needs to be fraud-proof. The only question is which platforms and coins will be the winners over the long term.
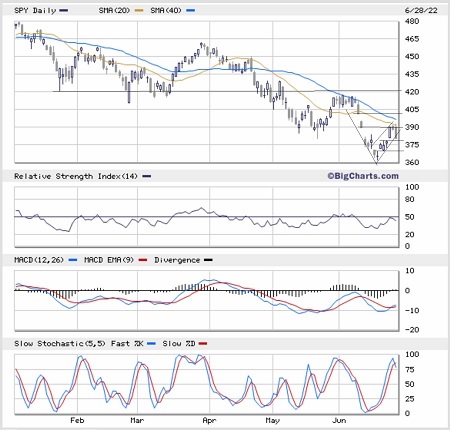
SPY Chart Review:
After getting the solid bounce I predicted in my mid-May post, almost reached my 420 targets for the SPDR S&P 500 Trust (SPY). The price moved up fast from deeply oversold conditions last week and likely needs to consolidate for a bit. SPY closed Tuesday at 380.65. Slow Stochastics is rolling over, but the other oscillators, Relative Strength and MACD, look more neutral. There are plenty of support-turned-resistance levels above, and indeed price seems to have been turned back from the convergence of a bearish gap from 390 (that has been filled on last week’s rally) with the 20-day simple moving average (SMA). There is another bearish gap to be filled above the 401 level, and a bullish gap closes below Tuesday’s closing price. It still doesn’t feel like a true “capitulation” has occurred. In fact, the price may be forming a bear flag pattern as shown, which could break to the downside, but I don’t believe this market is destined for a catastrophic selloff.
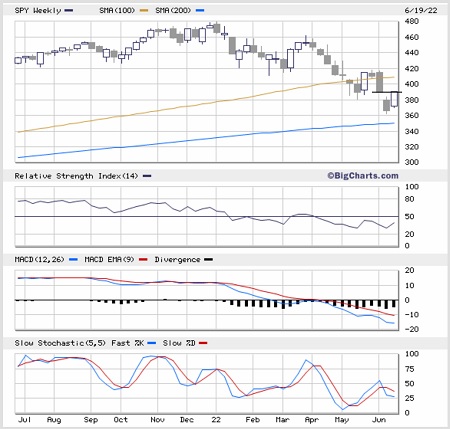
Looking at the weekly chart of SPY, you can see that last week’s strong rally brought the price back up to fill the bearish gap from the prior week. So, there might be some further upside heading into the end of Q2 and the July 4th holiday weekend…or perhaps a test of support at the 200-week SMA (around 350) is in store.
Notably, DataTrek looked back at the rolling 100-day price returns of the S&P 500 since 1999 and found that although they exceeded -17% declines twice during the past month, historically over those 23 years it has only exceeded -17% a handful of times – and only during serious macroeconomic events (such as the 2000 dotcom bust, 2008 Great Financial Crisis, 2011 Greek debt crisis, 2018 trade war/Fed tightening, and 2020 pandemic). DataTrek notes that, although this information corroborates the speed of the selloff, it doesn’t suggest whether the bottom is in.
Latest Sector Rankings:
Relative sector rankings are based on our proprietary SectorCast model, which builds a composite profile of each of over 1,100 equity ETFs based on bottom-up aggregate scoring of the constituent stocks. The Outlook Score employs a forward-looking, fundamentals-based multifactor algorithm considering forward valuation, historical and projected earnings growth, the dynamics of Wall Street analyst's consensus earnings estimates and recent revisions (up or down), quality, and sustainability of reported earnings, and various return ratios. It helps us predict relative performance over the next 2-6 months.
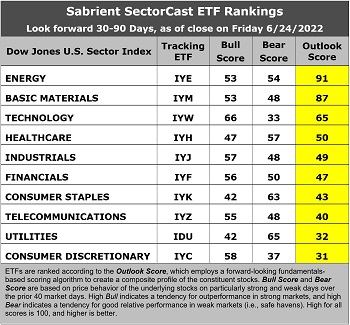
In addition, SectorCast computes a Bull Score and Bear Score for each ETF based on the recent price behavior of the constituent stocks on particularly strong and weak market days. A high Bull score indicates that stocks within the ETF recently have tended toward relative outperformance when the market is strong, while a high Bear score indicates that stocks within the ETF have tended to hold up relatively well (i.e., safe havens) when the market is weak.
Outlook score is forward-looking while Bull and Bear are backward-looking. As a group, these three scores can be helpful for positioning a portfolio for a given set of anticipated market conditions. Of course, each ETF holds a unique portfolio of stocks and position weights, so the sectors represented will score differently depending upon which set of ETFs is used. We use the iShares that represent the ten major U.S. business sectors: Financials (IYF), Technology (IYW), Industrials (IYJ), Healthcare (IYH), Consumer Staples (IYK), Consumer Discretionary (IYC), Energy (IYE), Basic Materials (IYM), Telecommunications (IYZ), and Utilities (IDU). Whereas the Select Sector SPDRs only contain stocks from the S&P 500 large cap index, I prefer the iShares for their larger universe and broader diversity.
Here are some of my observations on this week’s scores:
1. The rankings continue to be led by deep cyclical Energy and Basic Materials and with impressive Outlook scores of 91 and 87, respectively. These two sectors have consistently shared the top two spots since last September. You would expect strength in these cyclical sectors given their high earnings leverage within a growing economy and given still-strong oil and commodity prices. Energy enjoys the strongest analyst sentiment (recent positive net revisions to EPS estimates), the lowest forward P/E of 7.7x, good YoY projected EPS growth of 11.7%, an attractive forward PEG of 0.66, and the strongest insider sentiment (open market buying). Basic Materials displays a low forward P/E of 8.5x, good YoY projected EPS growth of 14.1%, an ultra-low forward PEG (forward P/E divided by projected EPS growth rate) of just 0.60, and solid return ratios – although its analyst sentiment has tailed off as commodity prices have fallen. Rounding out the top six are Technology, Healthcare, Industrials, and Financials.
2. At the bottom are Consumer Discretionary with an Outlook score of 31 and Utilities at 32. Consumer Discretionary has the highest projected EPS growth rate of 22.7%, but it continues to be hit with negative revisions to EPS estimates. Utilities is a low (but stable) growth sector (7.0%) that has been bid up to the highest forward P/E of 20.7x on the strength of its solid dividend yield, which is popular as a bond alternative, but its forward PEG is a high 2.94.
3. Looking at the Bull scores, Technology has the top score of 66 as stocks within the sector have displayed relative strength on strong market days. Utilities and Consumer Staples score the lowest at 42. The top-bottom spread is 24 points, which reflects low sector correlations on strong market days. It is desirable in a healthy market to see low correlations reflected in a top-bottom spread of at least 20 points, which indicates that investors have clear preferences in the market segments and stocks they want to hold.
4. Looking at the Bear scores, Utilities scores the highest at 67 followed closely by Consumer Staples at 63, as stocks within these defensive/dividend-paying sectors have been the preferred safe havens on weak market days. Technology displays the lowest score of 33, as investors have fled the sector during market weakness. The top-bottom spread is 34 points, which reflects quite low sector correlations on weak market days. Ideally, certain sectors will hold up relatively well while others are selling off (rather than broad risk-off behavior), so it is desirable in a healthy market to see low correlations reflected in a top-bottom spread of at least 20 points.
5. Energy displays the best all-around combination of Outlook/Bull/Bear scores, while Consumer Discretionary is the worst. Looking at just the Bull/Bear combination (investor sentiment indicator), Energy is the best, indicating superior and consistent relative performance (on average) in extreme market conditions whether bullish or bearish, while Consumer Discretionary is the worst.
6. This week’s fundamentals-based Outlook rankings display a bullish bias given that 5 of the top 6 sectors are economically sensitive or cyclical (Energy, Materials, Technology, Industrials, and Financials), while the more defensive sectors (Utilities, Telecom, Staples) are relegated toward the bottom. Keep in mind, that the Outlook Rank does not include timing, momentum, or relative strength factors, but rather reflects the consensus fundamental expectations at a given point in time for individual stocks, aggregated by sector.
ETF Trading Ideas:
Our Sector Rotation model, which appropriately weights Outlook, Bull, and Bear scores in accordance with the overall market’s prevailing trend (bullish, neutral, or defensive), retains a defensive bias. This suggests holding Energy (IYE), Consumer Staples (IYK), and Utilities (IDU), in that order. (Note: In this model, we consider the bias to be defensive from a rules-based trend-following standpoint when SPY is below both its 50-day and 200-day simple moving averages.)
If you prefer a neutral bias, the Sector Rotation model suggests holding Energy, Basic Materials (IYM), and Technology (IYW), in that order. Or, if you are more aggressively pursuing a bullish stance, the model similarly suggests holding Energy, Technology, and Basic Materials, in that order. So, in all three cases, the model suggests holding Energy.
An assortment of other interesting ETFs that are scoring well in our latest rankings include: Invesco DWA Energy Momentum (PXI), Invesco Dynamic Energy Exploration & Production (PXE), First Trust Natural Gas (FCG), First Trust Indxx Global Natural Resources Income (FTRI), Innovator IBD 50 (FFTY), iShares MSCI Argentina & Global Exposure (AGT), SPDR S&P Oil & Gas Exploration & Production (XOP), WBI BullBear Yield 3000 (WBIG), Vanguard Energy (VDE), Van Eck Vectors Steel (SLX), AdvisorShares Dorsey Wright Micro-Cap (DWMC), SPDR S&P Global Natural Resources (GNR), WBI BullBear Value 3000 (WBIF), Cambria Value and Momentum (VAMO), ETFMG Treatments Testing and Advancements (GERM), Invesco S&P SmallCap Energy (PSCE), SPDR S&P Metals & Mining (XME), WBI BullBear Quality 3000 (WBIL), VanEck Vectors Agribusiness (MOO), Avantis US Small Cap Value (AVUV), Barron’s 400 (BFOR), ProShares Equities for Rising Rates (EQRR), Columbia Seligman Semiconductor & Technology (SEMI), Proshares Nanotechnology (TINY), Alpha Architect US Quantitative Momentum (QMOM), Donoghue Forlines Yield Enhanced Real Asset (DFRA), BlackRock Future US Themes (BTHM), AdvisorShares Let Bob AI Powered Momentum (LETB), and Pacer Global Cash Cows Dividend (GCOW).

Comments
Log in or sign up to join the conversation.