
A Dozen Months & A Look At A Dozen Charts

Image Source: Pexels
With Q1 2023 behind us, here I offer a closer look at a dozen charts (almost all of them discussing ETFs) presented as monthly bars. This crude granularity allows one to see in simple terms what the long-term personality of each financial instrument is at present. I’ve put my remarks for each item below every chart.
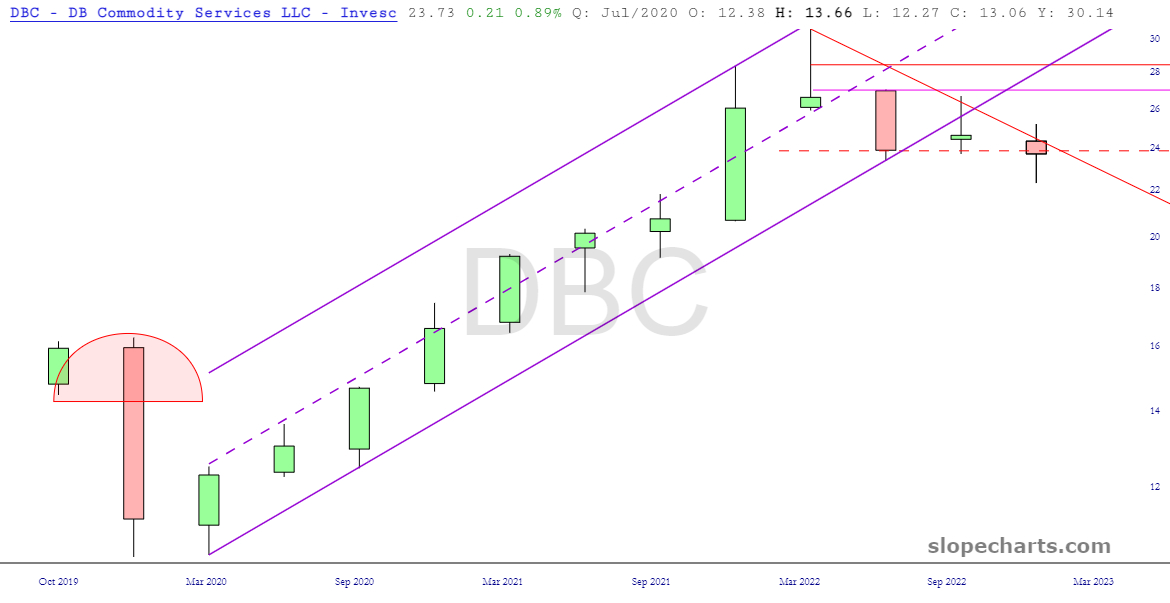
My view continues to be that commodities will lead the way lower. Q4 2022 was the start of this breakdown, and we made more progress in Q1. Energy continues to be my most dominant short sector.
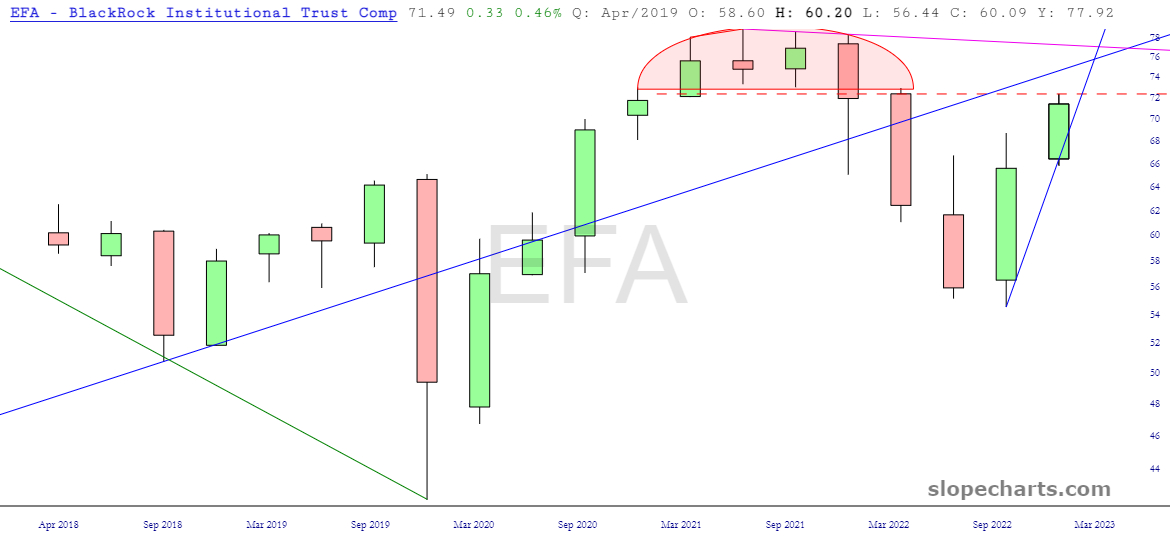
Worldwide stocks saw a huge recovery in Q4 2022, and that was augmented to a somewhat lesser degree in Q1. We have come full circle (well, full semi-circle) by retracing our way back to the base of the topping pattern.
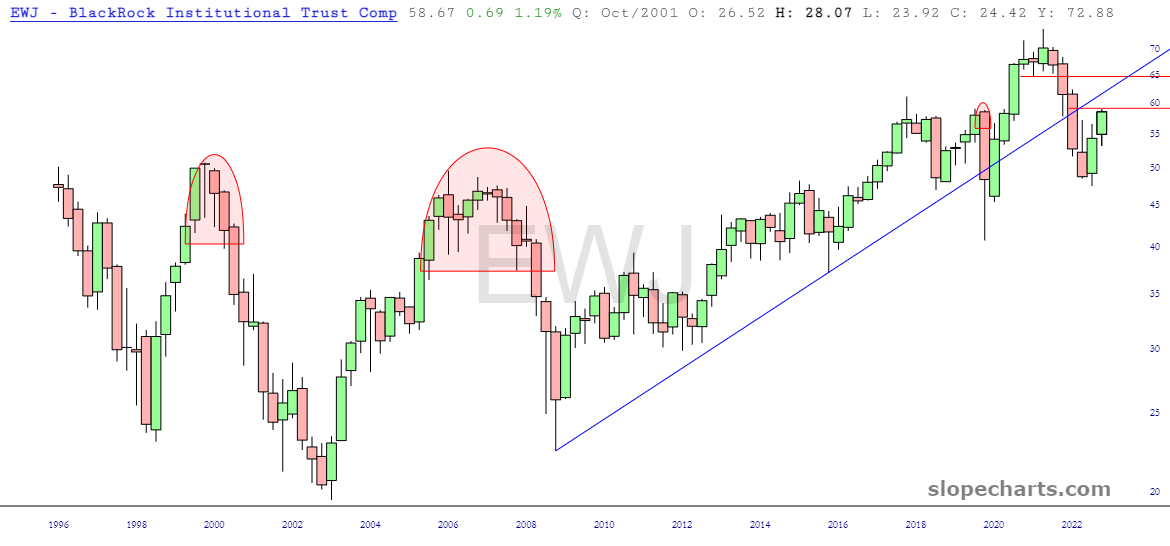
This ETF also executed a powerful retracement, managing to mash its way back to the underside of the broken long-term trendline.
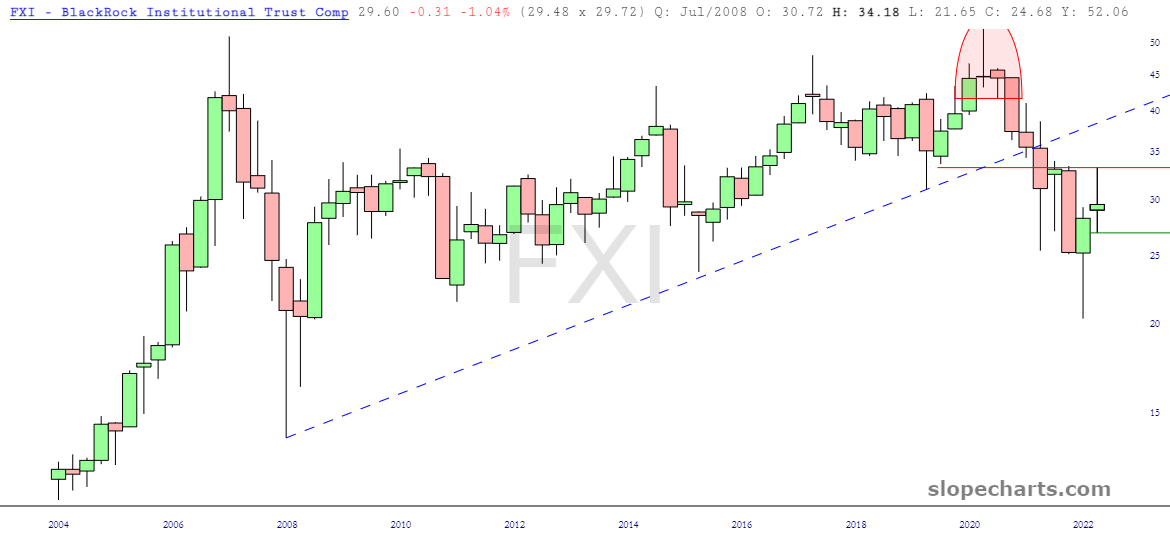
This one saw a relatively flaccid recovery. It managed at one point in Q1 to push back to resistance, but unlike most markets, it closed well below it.
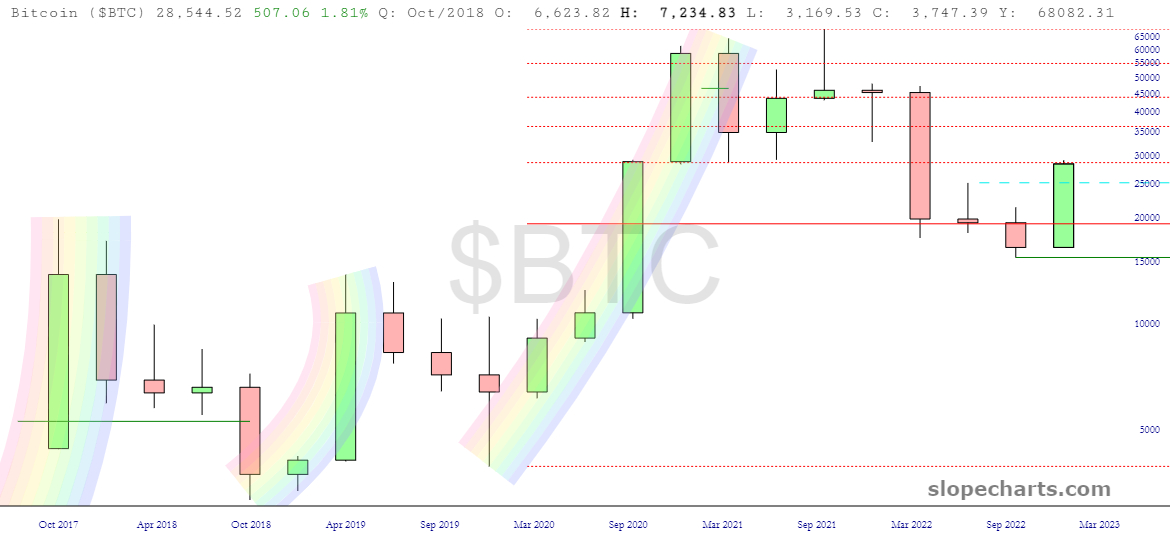
The only non-ETF here is Bitcoin, and it deserves special attention. Bitcoin saw an enormous gain – about 70% – and it has been sporting the first big green candle it has seen in a couple of years. As you can see, even with this monthly view, it did a pitch-perfect retracement back to its Fibonacci level.

High yield bonds illustrate nicely how frail the market truly is. It would take very little to send this market crumbling again.
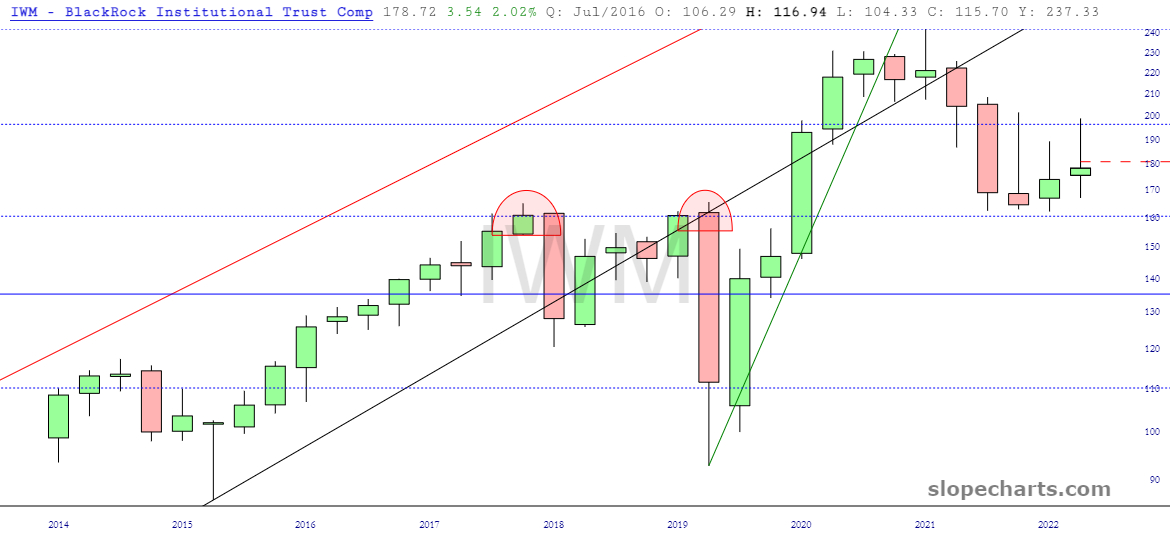
The small-caps were dramatically weaker than the likes of tech stocks, mainly because of so much weakness seen in the banking sector. The IWM has been tightly range-bound for the past four months.
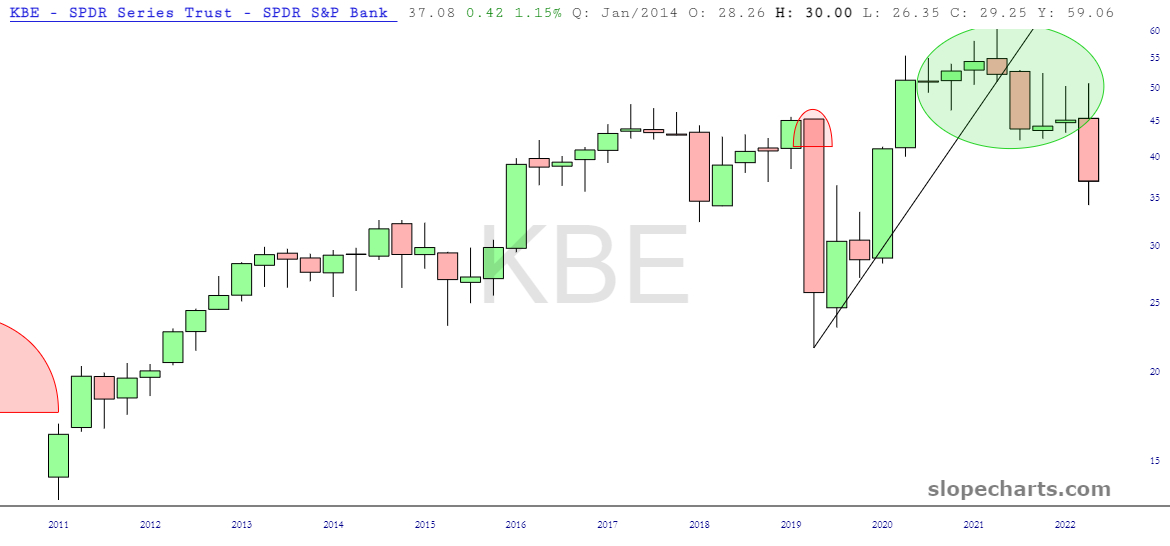
Speaking of banks, here you can see the March 2023 wipeout, the biggest seen since the year prior.
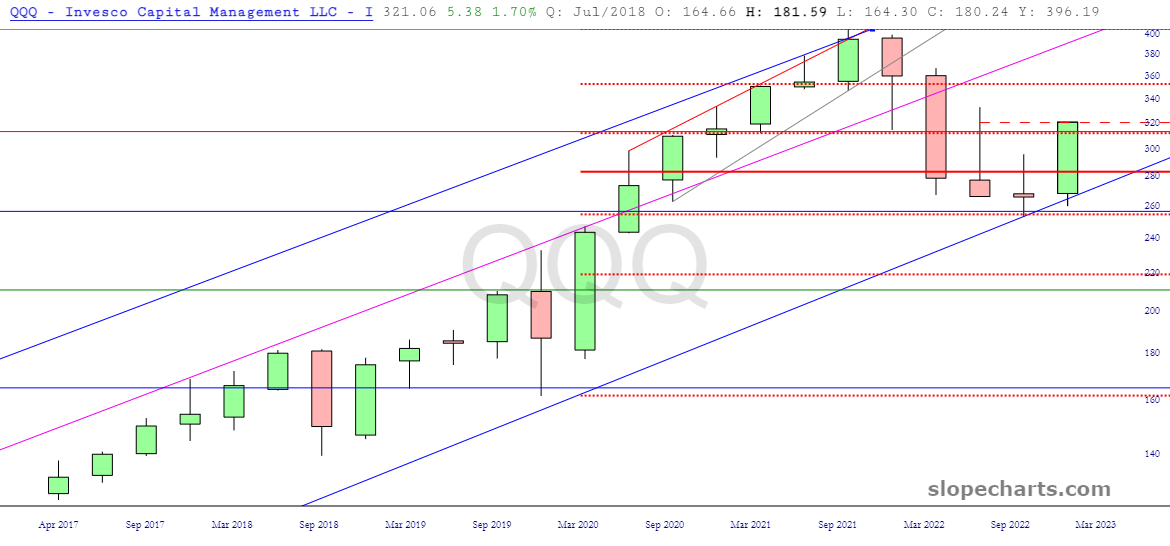
The most jaw-dropping rise in equities was from tech stocks, and the QQQ here sports the biggest green bar it has seen since about a year ago. The low for the quarter perfectly touched both the channel trendline, as well as the Fibonacci retracement. The end of Q1 was so strong that it actually pushed prices a little above a major Fibonacci level, sealing the gap of Aug. 19, 2022.

The ever-important S&P 500 fund is at the cusp of a possible breakout above its descending trendline. It hasn’t happened yet, but it is so close that it could easily happen the moment the market opens on Monday.

The crude oil fund has broken beneath its ascending channel, and it appears ready to break below its right triangle pattern.
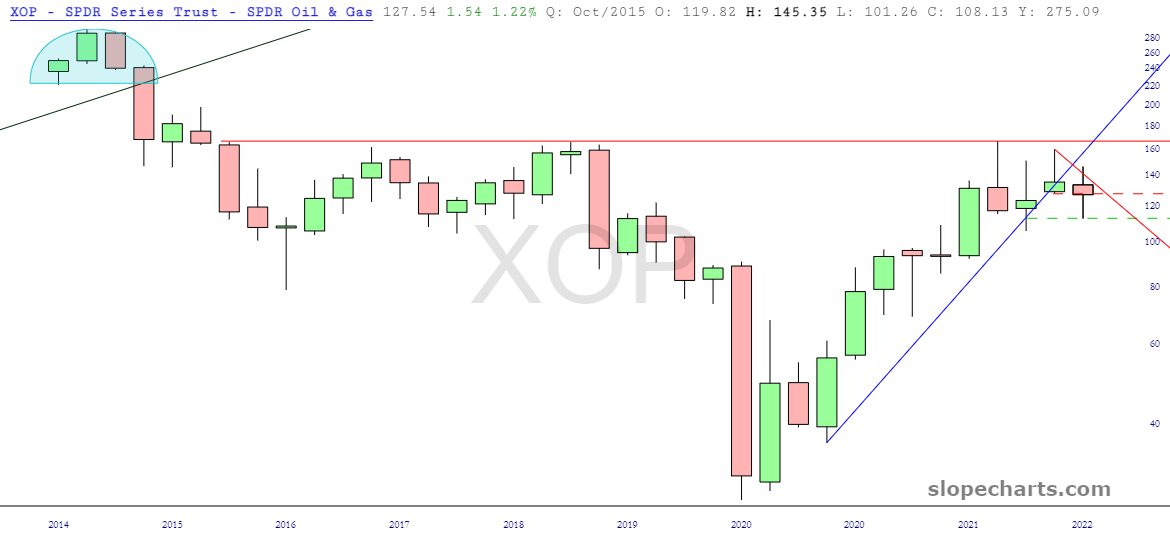
The oil and gas sector bears a strike resemblance, naturally, to DBC. This sector has plainly broken its uptrend, and even with the powerful rally in March 2023 for equities, XOP actually managed to produce a red bar for the month, plainly revealing its weakness.
More By This Author:
Rolling Downhill
Is Bitcoin Telling Us Something?
Back To Tesla


