

Image Source: Unsplash
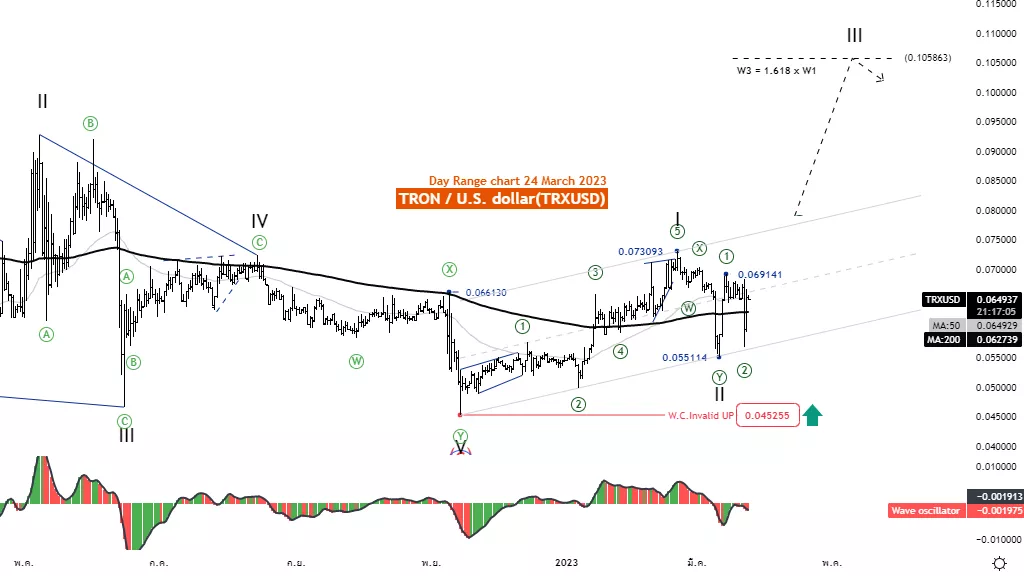
Elliott Wave Analysis TradingLounge Daily Chart, 24 March 2023.
TRON /U.S. Dollar(TRXUSD)
TRXUSD Elliott Wave Technical Analysis
Function: Follow trend
Mode: Motive
Structure: Impulse
Position: Wave III
Direction Next higher Degrees: wave (I) of Impulse
Wave Cancel invalid Level: 0.045
Details: Wave II is likely to end at the level of 0.055 and a five-wave rise from this level will confirm it.
TRON /U.S. Dollar (TRXUSD) Trading Strategy: Although a sharp drop has yet to break the price structure in an uptrend, TRON is once again standing above MA200. May lead to the 1.618 level of wave I at 0.10586.
TRON /U.S. Dollar (TRXUSD) Technical Indicators: The price is above the MA200 indicating an uptrend. The wave oscillators below Zero-Line momentum are Bearish.
Analyst: Kittiampon Somboonsod, CEWA
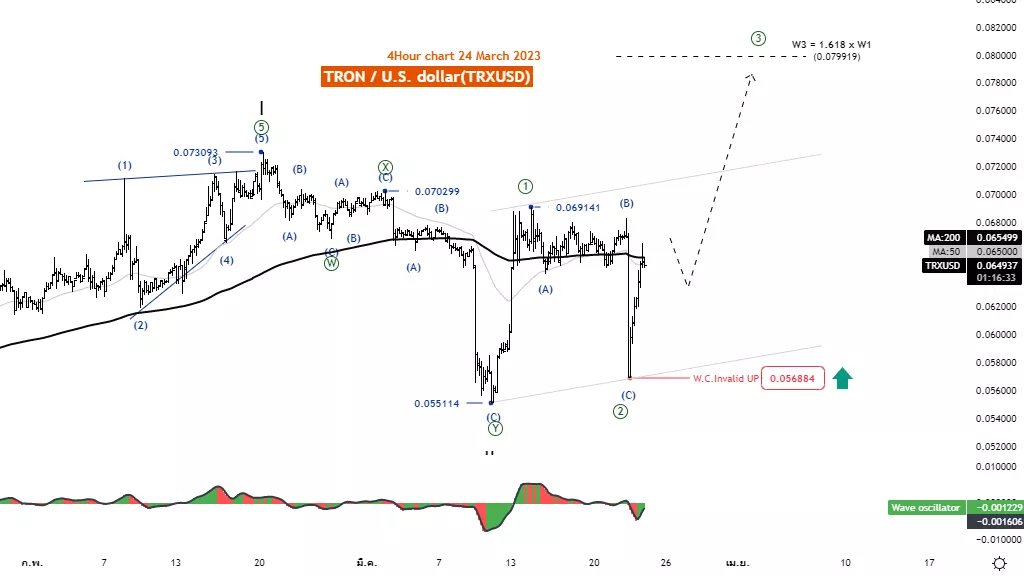
Elliott Wave Analysis TradingLounge 4H Chart, 24 March 2023.
TRON /U.S. Dollar (TRXUSD)
TRXUSD Elliott Wave Technical Analysis
Function: Follow trend
Mode: Motive
Structure: Impulse
Position: Wave ((3))
Direction Next higher Degrees: wave III of Impulse
Wave Cancel invalid Level: 0.045
Details: Wave II is likely to end at the level of 0.05688 and a five-wave rise from this level will confirm it.
TRON /U.S. Dollar (TRXUSD) Trading Strategy: Although a sharp drop has yet to break the price structure in an uptrend, TRON is once again standing above MA200. May lead to the 1.618 level of wave I at 0.10586.
TRON /U.S. Dollar (TRXUSD) Technical Indicators: The price is above the MA200 indicating an uptrend. The wave oscillators below Zero-Line momentum are Bearish.
More By This Author:
Elliott Wave Technical Analysis: Biogen Inc. - Thursday, March 23
Elliott Wave Technical Analysis: Bitcoin/U.S. Dollar
Elliott Wave Technical Analysis: Fortinet Inc. - Wednesday, March 22


Comments
Log in or sign up to join the conversation.